Tuesday, October 23, 2012

Bellow uptrend line

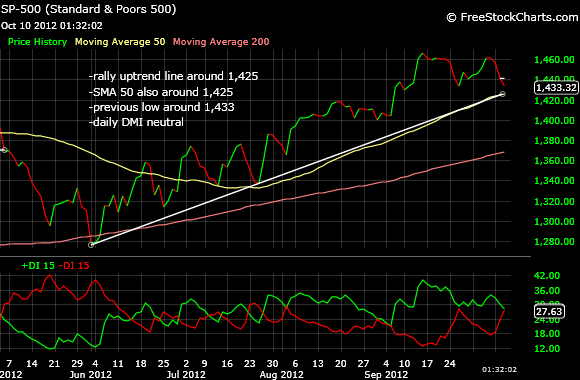
The day is not over yet but it looks like SPX is moving bellow the last line of defense for bulls, the 4 months uptrend line.


On two hours chart the most significant technical event is that SMA 120 is pointing down now. When we had the whip-saw SMA 120 was rising.


Weekly chart shows a move bellow a flat SMA 50 and a SMA 200 around 1,380. Also notice that weekly DMI is barely positive right now. A weekly DMI turned negative will confirm that we are in the middle of a correction.

Friday, October 19, 2012

Volatility

I was wrong, I predicted that bulls won't be able to defend the 4-month uptrend line this week but they did it. Well, at least for a few more days.

Technically we are at the same point as last Friday with SPX battling the 4-months uptrend line. Last Friday I've got a sell signal according to EMAs crossing, signal canceled this week, just to get another "sell" signal today. I am always suspicious when "buy" and "sell" signals appear one after another because they tend to mislead. Time to take a step back and look at other indicators.


On daily chart we have now a triple top but bulls managed to keep SPX above the 4 months uptrend line. If you really zoom in you can say SPX is 1-2 points bellow the uptrend line but this is not significative. Once again daily DMI is slightly negative. For this market to get bearish we need to see SPX bellow the uptrend line (now around 1,434) and a lower low bellow 1,428.


On weekly chart SPX appears slightly bellow SMA 50 and once again bears need to see SPX making a lower low, bellow 1,428. Weekly DMI is still positive but pointing down. 


The bull market uptrend line is now around 1,315 and SMA 200 is around 1,380. These two levels are going to be extremely significative support levels if market is going to plunge from here. 


Dow looks almost as SPX but Nasdaq seems to be the "weakest link" showing 3 lower highs and 3 lower lows on daily chart,  daily and weekly DMI on red, bellow SMA 50 and almost touching SMA 200. Not only that but the bull market uptrend line is around 2,900, very close to today's level. 


Are the bulls going to defend the 4-months uptrend line once again? We'll see it next Monday! Until then, all the best and have a nice week end!

babaro

Tuesday, October 16, 2012

Careful here

As you noticed I usually write a post at the end of the week. However, I am writing the third post in three consecutive trading days because things are unfolding very fast. The last front of defense for bulls, the 4 months uptrend line, was succesfuly defended. We have now a second day on the upside, that is a nice bounce up from the uptrend line. SPX has moved above the rising SMA 120 but EMAS are not giving yet a bullish crossing. This may be one of those whip-saws, this one probably 20-30 points loss, but this is the price I need to pay for trying to be (most of the time) on the right side. Link


Daily DMI has turned positive and SPX is now above rising SMA 50.


Since the signals from EMAs crossing are fuzzy at the moment I need to look at other indicators. The most important at this point is for SPX to get a higher high, somewhere above 1,460 on weekly chart. At the moment we have two lower highs and two lower lows which is bearish. To get bullish once again SPX needs a fresh higher high. If markets moves down in the next few days before establishing a higher high we are going to have three lower highs which again is going to be bearish. 


As expected UNG moved down from the upper edge of the uptrend channel and is going to be a good buy once it reaches the lower edge, somewhere around 19.5. The most remarkable thing about UNG is that we have now a "golden cross" for the first time since the beginning of 2008. This plus weekly DMI on the positive side makes UNG at its most bullish momentum in four years. 


Monday, October 15, 2012

Nice bounce...

... but not enough to cancel the "sell" signal. SPX bounced up from the 4 months uptrend line but remains bellow SMA 120.


Daily DMI remains slightly negative.


Friday, October 12, 2012

Another SELL signal

Please be advise that the "sell" signal is on intermediate time frame that I prefer to trade. On long term market remains bullish.

On two hours chart I noticed a clear EMAs bearish crossing. This and SPX bellow SMA 120 and especially the two reverse days we had give me a pretty good confidence that this sell signal is for real. 


This timing method is not flawless (we had an whip-saw in July) but is good enough to give you an edge and make a decent amount of money on both rallies and plunges. 


The last chance for this rally to be saved is for the market to find support around the 4 month uptrend line that is currently around 1,428. As I am writing this, SPX is exactly at this level but honestly I don't expect it to hold. Maybe for today but next week I am expecting market moving further down.


Weekly chart shows a bull market uptrend line around 1,300 and weekly DMI still positive so if you are investing in this time frame you still need to be bullish.


Have a nice trading day!

babaro

After the bell update:

SPX managed to stay above 4 months uptrend line and SMA 50. Next week bulls MUST push the market up. Otherwise... big plunge ahead!

P.S. over the weekend have a look at UNG. I must say I hate this ETF because I made a wrong call on it and lost some money in the past but I must admit now looks pretty bullish. Finally! Please notice the uptrend channel. Now is touching the upper edge meaning that is may go down again to the lower edge. However, if it manages to push above the upper edge we may have a winner.

There is a story on Market Watch about the new hybrid cars running on natural gas. You may like it if you are bullish on UNG.


Wednesday, October 10, 2012

Before the bell

This is the second day on the downside in a row. The trading day is not over but if remains around 1,433 like it is right now I can say the intermediate time frame has turned slightly bearish. SPX moved bellow SMA 120 for the first time since July. also EMAs are giving a little bit of a bearish crossing. It may become more obvious tomorrow if market continues to drop or even if stays flat. 


Daily chart shows that the 4 months rally uptrend line is around 1,425 and coincidently SMA 50 is also at the same level. SMA 200 is somewhere around 1,370 but daily DMI is almost turning negative for the first time since the end of July. 


On weekly chart I told you in previous posts that I keep an eye on the previous low, 1,440. Well, the market moved bellow this level which I consider a pretty bearish sign (one can argue that the week is not over and for the remaining two trading days bulls may push SPX again above 1,440). 


I think there is a pretty good chance that we are going to see a decent correction from here.

I may come back with details after the closing bell if anything dramatic happens meantime.

All the best!

babaro

Sunday, October 7, 2012

Waiting for something to happen

Market went up this week but not enough to make a decisive break on the upside. It remains slightly bellow the previous high on the weekly chart. Despite the few points gained this week the intra-day action was quite bearish, strong mornings but weak afternoons, almost reversal days in a few instances. What I don't like, from a bullish point of view, is that the market didn't react strongly once the QE3 news was released. We had a couple of days on the upside with a nice gain but that's it. No continuation, no meaningful rally. Granted the QE3 news hit the Wall Street after a nice three months rally! Keeping this in mind I am not as bullish as I was 2-3 weeks ago. If market manages to establish a clear higher high (1,490 or above) the rally is saved but any pull back before that and especially a drop bellow the most recent low on weekly chart (1,440) could spell trouble. 


Daily and two hours charts look a little bit better in a sense that market managed to equalize the most recent high (around 1,470) but no higher high as well. The 3-4 months rally uptrend line is around 1,420 which coincides with the rising SMA 50. So somewhere in the 1,420-1,440 area SPX should find support on intermediate time frame. 


Two hours chart shows a positive EMAs crossing and market above SMA 120. Also market is above both EMAs which usually translate in the fact that is a little bit overbought in short term time frame so a drop in the 1,450 area wouldn't be surprising.  


In conclusion, I remain bullish on long and intermediate time frames but I keep a close eye on a rally that seems to be out of steam despite QE3. 

All the best!

babaro

P.S. Two stocks you may want to consider, EPOC and ENOC