The title is a summary of the stock market as of today, August 28, 2015.
So we had a crazy week with SPX swinging about 150 points just to end up 20 points above last Friday close. On short term probably bulls managed to get a temporary bottom. On long term market remains bullish, or more exactly we are still in a bull market. However, the bearish momentum created in the last 10 days it's a big warning sign for bulls. They should not take this drop lightly despite the last three days on the upside.
Among many indicators, monthly MACD, that has a pretty good record at signaling the beginning or the end of a bull market, it's showing a bearish signal.


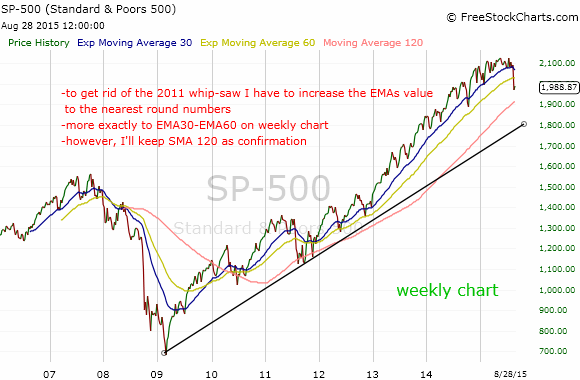
Monthly MACD had also two whip-saws in the last 20 years so you need to keep in mind that is not perfect. My EMAS adjusted for monthly chart (considered a month as equal to 4 weeks, therefore I divided al MAs to 4) had no whip-saw during the same period (give me some bricks to beat my chest -))
Well, actually in 2011 EMAs gave me a faint bearish crossing for a few days but it was not confirmed by SMA120 which fell bellow the SPX value in a very short time.

You must understand these EMAs I have found for SPX are not 100% accurate. Someone asked me a few days ago why EMA50 and not EMA 48 or 51? Of course it doesn't matter which one of these I am using, I used 50 just because it was the closest round number. It cracks me up when I hear people predicting that Dow will collapse to say 11,254. Really? When you do a prediction you need to use round numbers, 10,000 or 11,000 or you can go somewhere in between, 11,500.
Anyway, let's adjust a little bit my EMAs to get rid of this whip-saw. I'll go to the nearest round numbers EMA30-EMA60. It's ok if you do this kind of fine tuning once every 5-10 years. Otherwise, if you change them all the time just to look good in front of other people, you are just kidding yourself and lose money at the same time. So, from now on (actually from 2012 on) I am going to use this pair instead of EMA25-EMA50. This will give me a "sell" signal (like in "the beginning of a new bear market") at a lower value on SPX that the other pair but it will be more likely to generate a real "sell' signal not another whip-saw. I don't see any reason to change SMA120 to a higher value.
So here is how the new pair of EMAs look like. No big difference I must say.
Another thing I want to mention for the people who are not part of the old followers is that I prefer SPX to any other index, either Dow or Nasdaq. However, no matter what signal I am getting from SPX I want to be be confirmed by the other two indexes.
For example, at the moment Dow is the most bearish index since is the only one that went bellow the 6 years bull market uptrend line. At the same time Nasdaq is the most byullish. SPX, as usual, stays somewhere in between.


In conclusion, if you are long don't panic yet but be alert since I haven't see this kind of bearishness in awhile. Protect your gains with "stop-losses". Personally I hate stop-losses (I am going to tell you way some other time) and I prefer to protect my shares by buying "puts".
All the best!
babaro22


