Friday, May 25, 2012

Bulls win the week

After three weeks on the downside finally bears took a break and let bulls push SPX 22 points above last Friday level. Looking at the hourly chart one can say that intermediate time frame is bearish to neutral, SPX is still bellow the declining SMA 120, EMAS show a bearish crossing but EMAs are not declining anymore, they are rather flat.


However, looking at daily and weekly charts, the 22 points jump this week doesn't look that impressive. I need to see higher lows and higher highs to be convinced that bulls are trying to do something but this pattern develops in time, one week not being enough. I can say I was pretty impressed by the reversal day I saw two days ago, SPX went  down to 1,297 in the morning just to see it climbing up 20 points and finishing 3 points up. Unfortunately for the bulls I didn't see any follow up the next two days.


As I mentioned before I am watching the most obvious support levels, the head and shoulder drop prediction (1,290), SMA 200 (1,285) and bull market uptrend line (1,250). So far the 1,290 level was successfully defended but we may this level challenged again in the next few weeks. It all depends on the Greek saga. 


Dollar rallied for the forth consecutive week and consequently oil, gold and silver went a down this week.


Have a nice Memorial Day weekend!

babaro


Sunday, May 20, 2012

Weekly DMI has turned negative

On Friday morning bulls tried to due something due to Facebook IPO but by the end of the day they gave up another 10 points on SPX. This was the third week in a row on the downside, three weeks that saw SPX losing no less than 125 points. What its worth mentioning is that weekly DMI has turned negative on Thursday indicating that even the long term trend may turn bearish soon. And indeed market is only 15 points above SMA 200.


How much is the market going to plunge? This is hard to anticipate. It all depends if Greece is going to remain in the European community or not. If I have to trust the "head and shoulder" pattern I could say that market is going to plunge to 1,290 (remember how this prediction functions for HS: you measure the distance between the top and the neckline and that is the drop you expect from the neckline on the downside). SMA 200 is around 1,280 and even more important the bull market uptrend line is around 1,250. So from 1,250 to 1,290 we have a whole area that may function as a support level. But this doesn't take into account an eventual Greece exit from the European Community. If Greece goes out of the Community anything could happen from even a more drastic correction to seeing market plunging once again in a bear market.


Gold and silver had two good days but the bearishness persists. In a way silver looks more vulnerable than gold, it has lost almost 50% from its highest value but at the same time silver is still above the bull market uptrend line that is around $25 while gold plunged bellow this uptrend line. Weekly DMI for both silver and gold is negative and both show a "death cross", more obvious for silver.


The dollar went down for two days in a row giving gold and silver a break but ended up for the third week in a row. The strength in dollar is also spooking the metals&ironing stocks, WLT, X, MT, MTL, CLF.

Coming back to Greece, I heard the world leaders two days ago at the G8 meeting promising they will do whatever necessary to keep Greece in the European Community. This may please the market at least on short term. We'll see tomorrow how the market is going to react to such promises.

Take care!

babaro

Tuesday, May 15, 2012

Even lower

Market gets lower every day.  The majority of the support levels were overcame. SPX went slightly bellow the October-April rally support line around 1,335. 


The major uptrend line is around 1,250, still way bellow the current level so the long term uptrend is still bullish but is getting weaker by day. The weekly DMI, a pretty good intermediate-long term indicator is only slightly positive.  a few more days like today and yesterday and we'll see this indicator turning bearish.


As long as bad news are coming out of Europe I don't see bulls doing too much damage to the current downtrend. Maybe a relief rally here and there but nothing serious. Greece is going to have new elections but they are not sure when (sometime in May-June). It is possible that the extreme left party is going to win the elections and Greece is going to get out of the European Community.  If this happens market will plunge way bellow 1,300. 

Gold, silver and oil continue to go down but natural gas is moving up lately.


babaro

Wednesday, May 9, 2012

Outside the trading range

SPX plunged to 1,343 in the morning but amazingly enough, for the third time in a row, bulls managed to recover 20 points. Then came the final hour when bears were in control once again pushing SPX almost 10 points down. Market is now bellow the previous low (1,359) and is out of the trading range by a few points.  The next support level is around 1,345 (the March low), a level that was actually touched in the morning.


Weekly DMI continues to be positive but the gap is closing. The most bearish index is Dow that ended down for six days in a row and lost almost 450 points. Tomorrow it may be the seventh day in a row on the losing side for Dow (CSCO is down almost 3% after hours after reporting the earnings). 


Despite the recent bearishness I can't say bears are in control. I am saying this because every time market plunges somebody "up there" seems to jump on stocks and push the market strongly up. It happened today and it happened Monday and Tuesday as well. I suspect these are big players (fund managers).

Where are we going from here?  Probably further down but I want to see the bulls unable to push the market so strongly up after touching new lows. 

All the best!

babaro

Tuesday, May 8, 2012

Still in the trading range

Market slipped well bellow 1,359 today but bulls managed to recover no less than 16 points by the end of the day. Yesterday we had pretty much the same scenario, futures heavily down in the morning just to see the day ending flat. This gives bulls some hope that market won't plunge further down or at least the damage is going to be minimal. On the other hand market moved slightly bellow the head and shoulder "neck" on daily chart which is a bad sign for bulls since, in general, once this "neck" is broken market continues to decline.


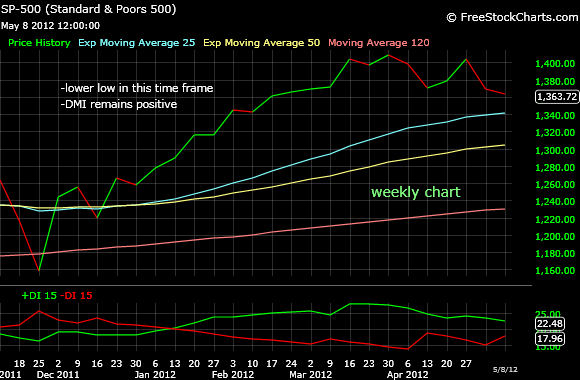
Weekly chart shown a fresh lower low but DMI remains positive on this time frame showing that the long term remains bullish.


With a dollar increasingly strong on European saga, gold is moving further down, today lost no less than 30 points. Technically, gold is at its worst moment in three years due to the "death cross" (the cross between SMA 50 and SMA 200). The strong 2009-2012 uptrend line was violated today, not by much but one should be at least a little bit concerned especially keeping in mind that both daily and weekly DMI are negative.


The major companies have reported their earnings so the only fundamental that influence the market are the news coming from Europe, especially Greece.

All the best!

babaro

Friday, May 4, 2012

Trading in range

After only one week I have another "sell"signal on hourly chart. This is very solid indication that market is trading in range and these "buy" and "sell" signals should not be trusted since they don't work in these conditions.


One of the most widespread cliche about stock market is "buy low, sell high". Sure everybody wants to buy low and sell later at a higher price. Unfortunately many people apply this principle in a wrong way. Every time people see a stock moving down they buy since the stock became cheaper. However, many times what is cheap today is going to be even cheaper tomorrow since the stock is in a downtrend. That is the piece of information many people ignore, what is the general trend, up or down? If the trend is down don't buy the stock no matter how "cheap" it may seem. I've saw many people bragging about buying cheap stocks during the 2007-2009 recession. They all lost their shirt. So instead of "buy low, sell high" one should "buy high and sell higher" in an uptrend and "short low and cover lower" in a downtrend.

The only time you can "buy low and sell high" is when the market is trading in range. The trouble is it takes a while until you realize market is not trending anymore and is trading in range. One of the signs that market is trendless is getting "buy" and "sell" signals one after the other on hourly chart, like the market did since March. The big question is when is the market going to be in a healthy trend again, either up or down? I don't have a clear answer to this question. The easiest way to do this is to figure out what are the upper edge and the lower edge of the trading range and watch when one of this trend lines are violated. But even that is not a sure way since many times market goes outside an well established trending range just to come back in the trading range after a short while.

On daily chart I noticed a not so obvious "head and shoulder" pattern. The important thing is if market slips bellow the neck line or not (1,370). If it does, HS pattern anticipate a drop in the 1,290 area. Just something to have in mind. More important is to see if market finds support at the previous low (1,359) or not.