Friday, February 24, 2012

Weekly gains but reversal day on Dow

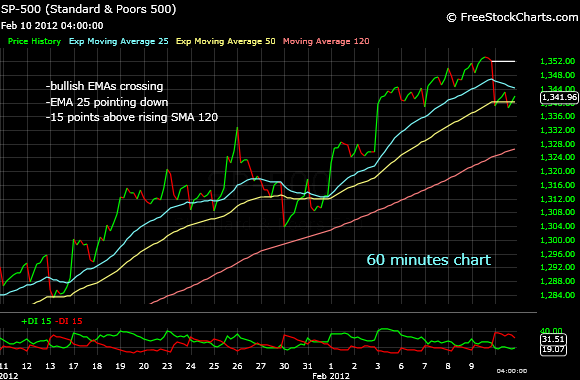
SPX secured another four points this week. This is not too much but enough to keep the bullish momentum going as confirmed by positive DMI on both daily and weekly charts. On hourly chart I notice that almost every time SPX goes a little bit bellow EMA 50 there are enough buyers to push the market up again. SPX didn't touch SMA 120 since the beginning of the rally two months ago. Over all SPX remains extremely bullish on all time frames.

The only sign of trouble comes from Dow. For the second time this week Dow touched 13,000 just to give up the gains and end the day in red. Reversal days after touching new highs are generally bad omens so if you are on the bulls' side a little bit of cautions is not going to hurt. The good news is that only Dow shows this behavior, while Nasdaq and SPX despite going down from intra-day highs managed to end the day a little bit on green.


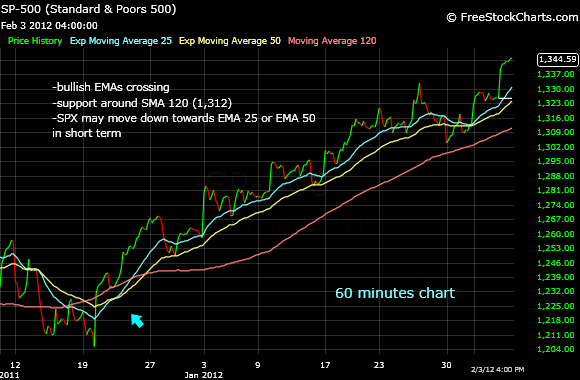
SPX has rallied no less than 267 points since October and one may think that a correction is going to come soon. As I mentioned before, unless some very bad news are going to hit the market I don't see a correction imminent. If markets goes down now, before establishing clear higher highs on all indexes, the long term momentum is going to suffer a big blow and by higher highs I mean well above April 2011 highs.


VIX is pretty low these days but it still has room for lower values.


Friday, February 17, 2012

Bullish week

We had another bullish week with SPX gaining 15 points and consolidating its position. SPX has touched now the May 2011 high, while other indexes already made higher highs.  Weekly DMI remains positive and EMAs show a bullish crossing on weekly chart.


On daily chart it is easy to observe an very narrow trading channel that has start forming in December 20th last year. Any move above or bellow this channel is going to be significant in my opinion.


On hourly chart we still have a bullish EMAs crossing, with SPX slightly overbought (10 points above EMA 50). The intermediate time frame momentum is going to change only if SPX is going to move bellow SMA 120. By that time most likely we are also going to see EMAs giving a bearish signal. But until then enjoy the rally if you are on the bulls' side.


AAPL is going up like crazy these days. Since March 2009 AAPL is trading in a nice trading channel. Now has moved above this channel (that has the upper edge around 470) so I am tempted to say that the stock is around $30 overbought. The trick is that a move outside a well established trading channel may also signal that the stock has "decided" to listen to different technical parameters, in this case could signal that it may continue to move on the upside at a higher pace than in the past. Another signal that the stock may be overbought is that the weekly DMI is at an extreme value. Personally, I wouldn't buy AAPL at this point since it may go down to the uptrend line which is now around 400 (quite far away) without affecting its long term bullishness.


I am more interested in a stock like F that is now looking pretty good long term (at a beginning of a new uptrend), after a pretty nasty drop when lost 50% of its value.


Plenty other stock look attractive at this moment. I'll have a look at few of them next week.

All the best!

babaro


Friday, February 10, 2012

Bulls buying every dip

Today was the exception but for the rest of the week SPX moved down in the morning just to immediately find buyers in the afternoon. Market remains bullish also a bit overbought on short term.
On intermediate time frame the support is around 1,325 (SMA 120).


However, a potentially bearish pattern is forming as I write. It's a "rising wedge", a bearish pattern that forms when market is making higher highs and higher lows but the higher highs are not as vigorous as at the beginning of the rally. The market is then oscillating in a narrower range.


The problem with this pattern is that everything is in the "eye of the beholder". You can imagine ascending or descending wedges at any time, it all depends how are you drawing the edges. The same chart as above, but edges are drawn slightly different and the rising wedge is not as obvious anymore.


Anyway, you need to take into account that market rallied in an almost straight line from 1,205 until 1,357 so a correction is possible at any time. What interests me is what type of correction is going to be, a weak one (no lower that 1,300) or a more powerful one. A big correction is not going to work well for the long term bullish scenario since the market is going to move down before having a chance to make a higher high (above 1,370).


Saturday, February 4, 2012

Golden cross

Finally we have a "golden cross" confirmation on the daily chart after we saw this crossing happened on weekly chart a couple of weeks ago. The only resistance ahead is around 1,365, the previous high but I don't think it's going to be a problem since two other indexes, Dow and Nasdaq, already established higher highs.


Needless to say that market is bullish on all time frames. However, on short and intermediate time frames we may see a little pull back or at least market trading flat for a few days. I say this because I am seeing SPX 12 points above EMA 25 on hourly chart and 18 points above EMA 50. As you noticed many times, SPX stays mostly around these two EMAs. Also, on daily chart DMI is pretty high, another reason market may cool down a little bit.


Long term looks very bullish, with EMA 20 crossing EMA 40 from bellow and market above SMA 75, the MAs that defined the bullish and bear markets in the last 20 years. This year we had a 100 points whip-saw, not too bad if we look at the big picture. Whatever happened in the second half of the last year was very serious, actually the biggest challenge this market had since the 2009 bottom so I am not too upset about the whip-saw.


Weekly DMI is relatively low showing that on long term more gains are posible.


All the best!

babaro