Friday, September 16, 2011

At a crossroad

I don't have too much time today to do a proper analysis on the stock market. The thing is that bulls pushed the index exactly at SMA 75 but not above. If they manage push it a few more points (above 1230) the long term is going to turn bullish as well. It all depends on the good or bad news from Europe. As far as I know Feds are going to have a two days meeting next week when they are going to take the biggest decision of all: QE3 or not QE3.


Among the stocks featured in the last few days the majority worked well. PFE gave a false sell signal on 5 minutes chart but the others worked well. My RIMM straddle worked very well since the stock plunged today (I needed a big move either up or down). WCRX, and QGEN working well on the upside. FFIV and MU gave a sell signal, granted not very clear, especially for MU.


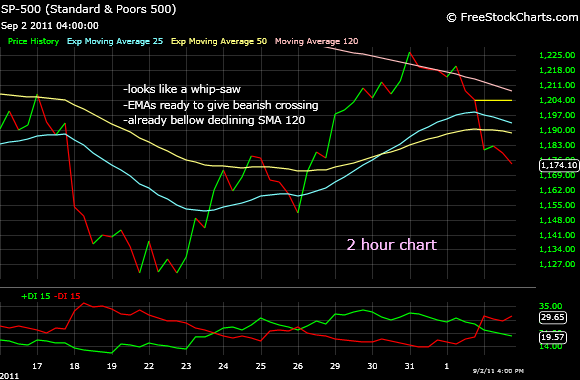
One can make money on shorter time frames using EMAs crossing but, as I mentioned before, the trouble with shorter time frames is that they generate many whip-saws. It all depends what type of trader are you, faster or slower.


Thursday, September 15, 2011

Fast trading

Few stocks i am watching. I bought a couple of Dec30 straddles on RIMM since the stock is trading in range for two weeks. The options also become cheap because VIX is low. I am making money if the underlying stocks jumps or plunges more than $2.


MU and FFIV are two stocks with a powerful short term momentum but they show signs of fatigue. I am watching in case they give a "sell" signal.


Wednesday, September 14, 2011

For faster players

Since market is trading in range lately, using EMas crossing on shorter times frames still gives good results.

Since I assume you have a job and don't have time to stay all day in front of computer I tried to avoid talking about short and ultra-short time frames. They could make you handsome profits but you must be aware that with faster time frames came more whip-saws.

First let's have a look at SPX on 5 minutes chart (you can use the same EMAs or even a little bit lower on 1 minute chart for day trading).

One word of advice, if you buy on a certain time frame be sure to sell on the same time frame. Don't buy on 5 minutes chart then sell based on daily chart.


Now let's have a look at two stock that just gave a "buy" signal on 5 minutes chart.


And a bearish crossing:


Tuesday, September 13, 2011

Two days on the upside

The market is not closed yet but it looks like we are going to close in green today. Yesterday was a spectacular reversal day with SPX recovering no less than 26 points in the last hour of trading. Reversal days usually "spill over" next day so I won't be surprised if market ends in green today.

One of my readers made me aware of the "symetrical triangle on daily chart, especially on Nasdaq. Let's have a look:


Looking at this chart one can argue that there is slightly bullish momentum behind this two days upside days. However, the pattern is not confirmed on other indexes. Not only this but you must be aware of the time frame. If a mini-rally starts here most likely is going to be temporary. The general picture, on long term time frame, remains bearish.


Talk to you later, after the close.

It's 5 pm. Market closed 10 points on the upside. If you are a short term bull you may rejoice at the news. However, intermediate and long time frames remain bearish.

The bearish EMAs crossing is now more evident on SPX and is starting to show on Dow and Nasdaq as well. It doesn't appear on QQQ but remember this is the ETF tracking only Nasdaq 100 not the whole Nasdaq.


Daily chart show lower highs and lower lows which is bearish. To change the trend SPX must close above the previous high (1,200). at this point is more likely we are getting a lower low (bellow 1155).


Saturday, September 10, 2011

I can see the bear market

Market has technically entered the bear market according to my timing indicators. SPX is bellow SMA 75 on weekly chart for a month by now but EMA 20 has also starting to cross EMA 40. The crossing is not that obvious unless you zoom in but the long term bulls better stay with the fingers on the "sell" button. Remember that SMA 75 funtion as an excellent long term support/resistance level in the last 20 years. It has only one small whipsaw in the '90s. At the same time EMA 20-EMA 40 (EMA 100-EMA200 on daily chart) crossing was absolutely flawless in the last 20 years and even before that. 


Of course the technicals are influenced these days by the Feds who can decide another round of QE any time. However, Ben did not mention anything about QE3 on two occasions in a row. 

On shorter time frame, on daily chart, it looks like the market is undecided and continues trading in the 1120-1220 range. For how long? It remains to be seen, I find almost impossible to predict when market is going to exit a trading range. Maybe other people have clues about these "signs", and I want to hear about them. 


The problem these days is that I cannot make money these days with my EMAs crossing since I am getting whip-saws no matter if I am using hourly or two hours charts. Maybe two hour chart is still OK, since even if I've got a few whip-saws generated by EMAs crossing I didn't get any confirmation from SMA 120 (that was briefly crossed once, indeed) that was descending all the time.


This week was particularly wild with SPX moving up or down 20-35 points every day. Let's see if the support around 1120 is going to hold this time. Bears unsuccessfully tied to bring market bellow this level three times since the beginning of August.

Take care!

babaro


Monday, September 5, 2011

Bellow major resistance level

SPX finished the week bellow the major resistance level around SMA75 on weekly chart (1215). It looks like market is going south from here and most likely we are going to see new lows. EMAs are touching on weekly chart but no crossing yet (if you really zoom in you can argue that they are already crossing a little bit).


On intermediate time frame we still have a bullish EMAs crossing on both hourly and two hours chart but SPX is bellow SMA 120. On two hours chart SPX barely managed to climb above SMA 120 last week but immediately fell bellow. Please notice that DMI has turned negative on two hour chart. As I warned you last week when two conflicting trends emerged on different time frames my bias was bearish despite the bullish signals generated on intermediate time frame.


Let's see now how much the market is going to fell. Is it going to go towards 1120 (previous low) then up again establishing a trading range or we are going to see lower lows? With market waiting for good news from Feds this month (QE3) a trade in a wild range is not out of question but we are most likely going to see new lows, bellow 1,100.

As for stocks to short, besides the usual ETFs, QID, SDS, FAZ, TZA almost every stock looks like a good short. Usually I go with ETFs but when I see opportunities I jump on individual stocks as well.

All the best!

babaro

Thursday, September 1, 2011

Two stocks I am watching

Time for a morning update.

SPX managed to climb 3 points above SMA 75 on weekly chart but bulls don't seem too convinced to go further up.


I am watching two crappy stocks that suffered huge losses in the last few months but show now signs of recovery at least for a short "kill".

RIMM looks like is giving a "buy" signal.The best fitted EMAs for this stock, keeping in mind the last rally and the following plunge are EMA 12-EMA24 on daily chart. DMI has turned positive. SMA 200 is around 48, a level where the current rally may end.


The other stock is BAC. There is no buy signal yet for BAC but it may follow soon if general market continues to grow. Daily DMI is slightly positive. Both are high risk stocks. Take care.


I am going to have a look at some stocks to short later today..