Saturday, December 17, 2011

Bearish action

 SPX went up in the morning  3 times this week, just to gave up almost all gains. This is bearish, of course at least on short term.


The opposite is true when market tries to make a new low then bounce up immediately as that level is touched. Gold looks in this position at the moment. The major uptrend line is around 152 on GLD or 1560 on gold. Gold touched that level a few times intra-day followed by a move on the upside.


On intermediate time frame SPX it's exactly in the middle of the "symmetrical triangle". The upper edge is around 1255, the lower edge is around 1185. I am talking here about the symmetrical triangle formed in the last 3 months. If you look at the one formed by the uptrend line on weekly chart the edges are a little bit pushed further away, upper edge around 1260 and the lower edge around 1170. It doesn't really matter which triangle you have in mind since the edges are pretty much similar. The idea is if any of this edges are "conquered" the move in that direction is going to get speed. Since the 2009-2011 uptrend line was crossed already 3 times, another cross could be the one pushing SPX into a new, fresh bear market. 


According to my timing indicators we are already in the bear market (EMA 20 crossing EMA 40 on weekly chart, market bellow a declining SMA 200) but fundamentals are not there yet. As you know to be in a bear market we need to have two consecutive quarters with negative growth. Fundamentals are usually 6-9 months behind the technicals. Last recession market started collapsing in October 2007 but we didn't know about the negative growth on the first quarter until April 2008 and the bear market was official 3 months later when we had the confirmation that the second quarter of 2008 had also negative growth.

Wednesday, December 14, 2011

Really frustrating market, no trend at all, you cannot bet with confidence neither on the upside nor on the downside.  Is the 3 days in the row on the downside, indeed but yesterday morning SPX was around 1250. This is an excellent market for the day traders, for the rest of us, not so good.


Anyway, the daily DMI has turned negative, once again and as expected the weekly DMI remains on red as well. Looking at both daily and weekly DMI I can see some support in the 1217-1220 area. Market may move up a little bit from here but don't bet too muc on it. The major support, on weekly chart is around 1170. That's the level we should keep a close eye on. On intermediate time frame the uptrend line is around 1180 so this area, 1170-1180 is were the market will decide if it wants to go bearish or bullish on long term.


Gold has another bad day. The weekly DMI just turned negative for the first time in 3 years! Also for the first time in 3 years gold moved bellow SMA 200. Now the major support remains 152 on GLD (translated as 1560 on gold). Bellow this level things are going to get really ugly.


Monday, December 12, 2011

Gold

Important movement in gold today. GLD moved bellow the July-December uptrend line and now the next support level is around 1610, the YTD uptrend line. Bellow that is the September low around 1580


I don't think gold holders should panic yet since overall gold is still bullish at the technical level. The major support in my opinion is 1520, the 3 years uptrend line. Bellow that is going to be carnage but not yet. Gold may also find support around SMA200 (1,580). Speaking of SMA200 one should notice that is pointing up which is bullish. Also there is no "death cross" yet (SMA 50  crossing SMA 200 from above). Weekly DMI is still positive but not by much so pay attention to this long term indicator.


All the best!

babaro

P.S. I hope I'll have time to do an analysis of the general market at the end of the trading day.

Thursday, December 8, 2011

Finally some action

I lost count how many times SPX bumped into the 4 month downtrend line in the last few days. Today, with fresh news from Europe, market finally "decided" to move down. How much is going to plunge? The major support is the 2009-2011 uptrend line that is now around 1170.


First support level is in the 1215-1225 area where we can also find SMA 50. However, SMA 50 was pretty much ignored in the last year or so, it wasn't neither a good support or a good resistance level so if SPX is going to take a break in the 1215-1225 area is going to be due to a significant volume occurred at this level rather than due to SMA 50. SMA 200 on the other hand pretty much capped any significant gain since August until today. It is now around 1260.


On two hour chart I noticed that DMI turned slightly negative indicating that the recent mini-rally has come to an end.


On short term I expect more volatility and I don't think if the market is going to head towards 1170 is going to be in a straight line. On longer time frame market it also seemed to be volatile but as the "symmetrical triangle" narrows I expect SPX oscillating in between closer values. Any move above the 4 month downtrend line or bellow the 2009-2011 uptrend line are going to be followed by huge moves on the upside or the downside.

babaro

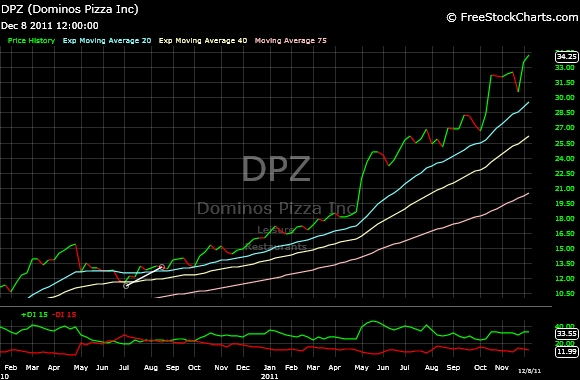
P.S. Can you imagine stocks moving up despite all the negativity around? And I am not talking about penny stocks, I am talking about stocks like, MCD, DLTR, DPZ.


Saturday, December 3, 2011

Reversal day

Market got close to the downtrend line (around 1265) but then went down. This is a bearish movement indicating that this week rally is close to an end. However, if market manages to go above the downtrend line and especially manages to establish a new high (above 1,290) then bulls are going to be in control for a decent period of time. It all depends on the European saga.


Weekly DMI continues to stay negative despite two powerful rallies we had since the beginning of October. Daily DMI on the other hand has turned positive once again. Remember DMI is a non-price type of indicator, it only takes into consideration the lows and the highs made during the previous day (or week) and gives information about the direction and the magnitude of the trend.


I added a few more stocks to my watch list. I don't own any of these stocks yet since I am waiting for something to happen first, a move above or bellow a trend line, a move above a moving average, weekly DMI changing direction...


Monday, November 28, 2011

My "watch" list

Market bounced up from the uptrend line as expected. It will probably continue for the rest of the week but after that is hard to imagine market will go back to 1280. We'll see!


For tonight I decided to share with you the stocks I have on my watching list. They are very strong stocks with very nice uptrends but some of them show signs of fatigue. The idea is that if I see the 2009-2011 uptrend line broken I am going to short them. They are all weekly charts. I decided not to show the EMAs but instead SMA200. This MA is not really a good timing indicator, especially for individual stocks. However, if stock is bellow SMA200 and also SMA200 is starting to point down the chance of a false sell signal is minimal.


Don't even think about shorting the following stocks right now. They may become good candidates in the future.


Some of them show double or triple tops.


Others are in a "symmetrical triangle formation" meaning that there are both an uptrend and a downtrend line. Stock may break either line but most likely they are going to break on the downside.


One very bullish, actually too bullish and too far away from the trend line.


babaro

Wednesday, November 23, 2011

Trend line

Market moved another 60 points down since my last post but bears may take a break here. I told you last time that if market goes bellow 1220 the next stop is going to be 1120. Well... I didn't realize that the new 2009-2011 uptrend line (the 4th so far) is around 1160, the level almost touched today.


These bull market trend lines are very important. Once they are crossed they spell trouble for the market. At the same time they are good support levels so if you are in the bears' camp (and I hope you are) you may be carefully here since a bounce on the upside is possible. Even if the market is going to bounce up from here I don't think is going to be for real, meaning that market will eventually go bellow the uptrend line.

Looking at the weekly DMI I can see that there is plenty of room for more downside movement since the red line is far from forming a peak.

The two hours chart give some useful information as well. The sell signal generated around 1220 was real but DMI is forming a peak so, again, we may see a bounce up from here or at least a few flat days. It all depends on your time frame. If you are a fast player you may need to take in consideration these signals, if not you don't need to bother too much since the market most likely is going to resume its fall after a brief move on the upside.


I am going to stop here, my hand still hurts after my accident.

Happy Thanksgiving!

babaro

Thursday, November 17, 2011

Testing the trading range

I am going to be short since I can't write very fast (had a small accident on my right hand). SPX is once again testing the upper edge of the former trading range. Last time it touched this level market bounced up to 1,275. This time it may be different. If market goes down tomorrow and the next week, the next support level is very close, 1,208 (SMA 50). I can hardly see any support level from 1,208 to 1,120, the lower edge of the former trading range.


On weekly chart, notice that SPX went a little bit bellow SMA75 and that DMI continues to stay on red. It turned negative in July around 1270 and never turned green afterwards. Also notice that the "death cross" is still present.


As you remember the only time frame that gave some decent buy and sell signals was the 2 hours chart. Notice that EMAs are slightly crossing on the bearish side and that market is bellow SMA 120.


Tomorrow is a key day. If market bounce up bulls are saved once again. If it goes down most likely we are at the beginning of a new "wave" on the downside. Sure some of you may say the best entry for shorts was yesterday at 1260. Well... remember that my timing method doesn't catch neither the tops nor the bottoms but enough to make a profitable trade.

all the best!

babaro

Sunday, November 6, 2011

Above rising SMA 75

After giving up 70 points in two days bulls pushed SPX up again to 1260 just to lose a few more points on Friday. The bullish news is that both SMA 75 and the upper edge of the former trading range behaved like a very good support level. SMA 75 is rising once again, another bullish signal.


Another indicator I haven't talk in a while is MACD. I usually look at MACD histograms for possible negative or positive divergences. This time I am going to talk about MACD by itself since I noticed that this indicator just gave a buy signal on weekly chart.  The signals on weekly chart are usually very good, not so much on daily chart (many whip-saws, more than EMAs crossing) so please take note that it turned bullish after giving a pretty good "sell" signal in March (!) well before weekly DMI or other indicators turned negative.


Looking at the bigger picture (2007-2011) I can easily draw the new uptrend and downtrend lines. The downtrend line is around 1,330 and the new uptrend line is now around 1,150. With all this uncertainty it is possible to see market bouncing in between these levels, kind of lateral movement.


Every time the uptrend line on weekly chart was crossed the market dropped 100-300 points, the last drop being the worst from 1,370 to 1070. We are now looking at the fourth uptrend line using the new temporary bottom around 1135 on weekly. It may take a while before we are going o see this uptrend line crossed but expect a big drop as well. Just because we saw SPX at 1070 just a few weeks ago it doesn't mean a new drop to that level is going to be as benign as the last one.


To summarize here are the bullish and the bearish signals on different time frames.

Bullish:

-SPX above rising SMA 75 on weekly
-rising SMA 75
-bullish MACD on weekly
-positive daily DMI
-powerful bounce once SMA 75 was touched

Bearish:

-bearish EMA 20/EMA 40 crossing on weekly
-"death cross" (SMA 50 crossing SMA 200 on daily) still present
-MACD almost giving a "sell" signal on daily
-slightly negative weekly DMI
-SMA 200 slightly pointing down on daily

Have a nice trading week!

babaro

P.S. Like I don't have enough problems I've got another reason to get upset today. I am coaching a 7 years old football team (or soccer as it's known in US). I know this sport is supposedly not very popular in US but trust me the people involved, kids, parents, coaches are really enthusiastic during the games. We had a tournament in the last 3 days and we did very well, we won all the games until today. In the morning we won another game and qualified for the final. In the final we met a better team and we lost 3-1. I was actually very pleased with the result but the kids (all of them) started crying at the end of the game. They really broke my heart! 

Tuesday, November 1, 2011

Two ugly days

Just when I was ready to admit that I was wrong about the long term bearish view SPX moved down almost 70 points and found support only at the upper edge of the previous trading range. This is slightly bellow SMA 75 on weekly chart, a level I always have in mind when looking at the big picture. Bulls did all the right moves, pushed SPX above the trading range, then above the resistance level around 1270 where the plunge begun. They even pushed the market above SMA 200.


EMAs still show a bearish crossing on weekly chart despite the fact market rallied more than 200 points last month, from the 1075 bottom to 1290 top. Weekly DMI continues to remain bearish but also daily DMI has turned negative. Bulls still have a chance to turn the table in their favor on long term if and only IF they manage to push SPX above the trading range and SMA 75. This is bulls' best support level. If market re-enters the trading range the next good support level is 100 points bellow, around 1120.


The news are driving the market these days. After getting help from Europe the Greek population most likely is going to reject it since the help is going to come with some strings attached, more austerity. Personally, I think Greeks are shooting themselves in the foot long term with their refusal but it's their choice. Overall the European picture is not that great. Keep in mind that Greece is not the only country in trouble is just the most affected by the crisis. Ireland, Spain, Portugal and even Italy are not far away.
From what I am reading the referendum is not a done deal since the Papandreou government is almost collapsing but uncertainty is also a market killer.

The dollar is also killing the market. UUP jumped for a third day in the row and now is touching the upper edge of the trading range. Yes, the dollar was also trading in range since March. If you look at it's chart is the reverse of SPX (no surprise here).


Let's see how the Greek drama is going to end. We are going to know this on Friday when the Greek government is going to endure the confidence vote. Meantime most likely the market is going to move down but maybe not as violent as in the last two days.

All the best!

babaro

Sunday, October 23, 2011

Outside the trading range

On Friday SPX managed to close outside the trading range and 23 points above SMA 75. This is the 4th break out of the trading range channel, we had a strong one on the downside and two weak ones on the upside, all of them short lived (one day). It remains to be seen if the last break is going to be for real one or is going to be another another false one. In order to be real we need to see a confirmation of the upside movement with market continuing to steadily go up and an eventual retracement towards the upper edge of the trading range (1,230) or at worst towards SMA 75 (1,215).


Right now bulls are having their best momentum since the beginning of the plunge, a few months ago, with SPX above both the trading range and SMA75 and daily DMI turned positive. Of course until weekly DMI turns also positive the long term is going to stay bearish but so far so good for bulls. Not to mention that EMA 20-EMA 40 crossing on weekly chart is still bearish!


Looking at the2 hours chart, the only time frame that gave decent signals as far as EMAs crossing was concerned I notice that breakout doesn't look as impressive since the upper edge of the trading range is around 1232 so we are only talking about 6 points above this level. 


As I mentioned many times SMA 75 on weekly chart functioned as a very good support/resistance level in the last 20 years (it gave only one false bear market signal in the 90's). SMA 200 on daily chart starting to point down is also a good indicator that market has entered a bear market. Most of all EMA 20 crossing EMA 40 on weekly chart was absolutely flawless in the last 20 years and beyond. I wrote an article last year about this EMAs pair crossing looking back to 1970 (I forgot the name of the article but you can look up) and the buy/sell signals were absolutely impressive. I think I used EMA25/EMA50 to take into account that the last pair of EMAs also functioned well for Nasdaq that tends to be choppier than DOW and SPX. If this time market manages somehow to "cheat 3 deaths sentences" (SMA 200 pointing down, market crossing SMA 75 on weekly and especially EMA 20 crossing EMA 40) then all these three long time, well tested, market timing methods need to be retired. It also means that the amount of market intervention is higher than at any times in history which is probably true. 

Let's see how market is going to react this week.

All the best!

babaro