I lost count how many times SPX bumped into the 4 month downtrend line in the last few days. Today, with fresh news from Europe, market finally "decided" to move down. How much is going to plunge? The major support is the 2009-2011 uptrend line that is now around 1170.

First support level is in the 1215-1225 area where we can also find SMA 50. However, SMA 50 was pretty much ignored in the last year or so, it wasn't neither a good support or a good resistance level so if SPX is going to take a break in the 1215-1225 area is going to be due to a significant volume occurred at this level rather than due to SMA 50. SMA 200 on the other hand pretty much capped any significant gain since August until today. It is now around 1260.

On two hour chart I noticed that DMI turned slightly negative indicating that the recent mini-rally has come to an end.

On short term I expect more volatility and I don't think if the market is going to head towards 1170 is going to be in a straight line. On longer time frame market it also seemed to be volatile but as the "symmetrical triangle" narrows I expect SPX oscillating in between closer values. Any move above the 4 month downtrend line or bellow the 2009-2011 uptrend line are going to be followed by huge moves on the upside or the downside.
babaro
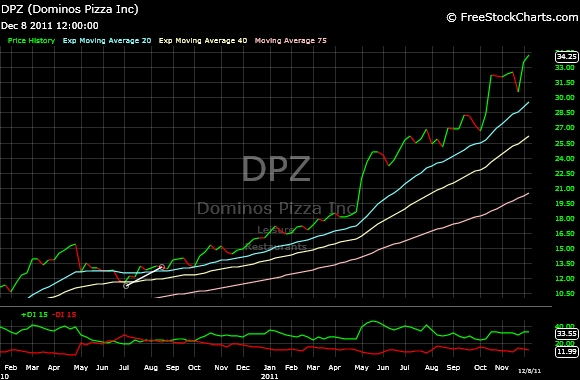
P.S. Can you imagine stocks moving up despite all the negativity around? And I am not talking about penny stocks, I am talking about stocks like, MCD, DLTR, DPZ.


First support level is in the 1215-1225 area where we can also find SMA 50. However, SMA 50 was pretty much ignored in the last year or so, it wasn't neither a good support or a good resistance level so if SPX is going to take a break in the 1215-1225 area is going to be due to a significant volume occurred at this level rather than due to SMA 50. SMA 200 on the other hand pretty much capped any significant gain since August until today. It is now around 1260.

On two hour chart I noticed that DMI turned slightly negative indicating that the recent mini-rally has come to an end.

On short term I expect more volatility and I don't think if the market is going to head towards 1170 is going to be in a straight line. On longer time frame market it also seemed to be volatile but as the "symmetrical triangle" narrows I expect SPX oscillating in between closer values. Any move above the 4 month downtrend line or bellow the 2009-2011 uptrend line are going to be followed by huge moves on the upside or the downside.
babaro
P.S. Can you imagine stocks moving up despite all the negativity around? And I am not talking about penny stocks, I am talking about stocks like, MCD, DLTR, DPZ.


No comments:
Post a Comment
Thank you for your feed-back