Thursday, April 26, 2012

Trend change

It's 3:30 pm and need to due a market update. after hours I'll come with details.

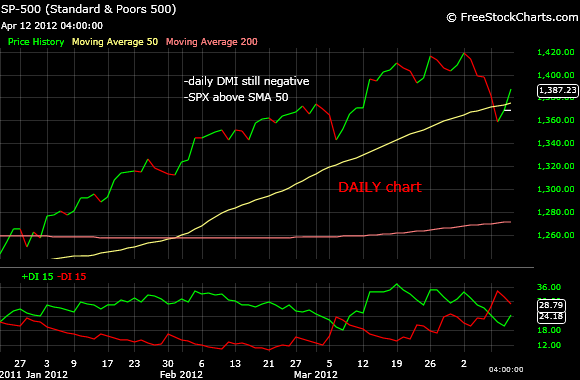
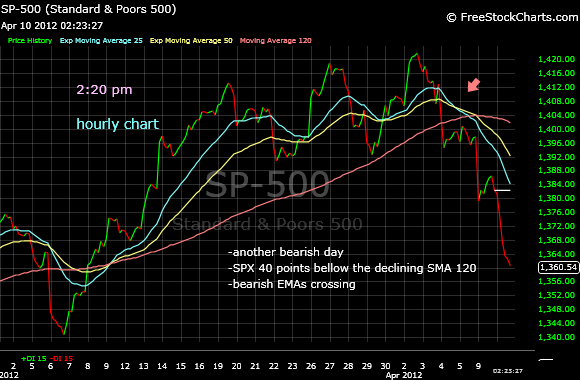
I've got a "buy" signal this morning on hourly chart that is also confirmed on two hours chart.
I am not very convinced about this leg up since the "buy" and "sell" signal came out one after the other with two little time in between. Statistically we are entering a period of time not too favorable to stocks (you know the "sell in May and go away" cliche) and the situation in Europe is far from over but a "buy" signal is a "buy" signal and market may defy logic one more time.


4 pm update

No big changes at closing time, SPX just lost two points but all the technical aspects remain the same. The big question now is how much should I trust the new "buy" signal? On one hand I am suspicious since too many signals were generated in a relatively short period of time, a clear indication that market is confused. On the other hand all "buy" signal worked well in the recent past, what I had problems was with the "sell" signals that proved to be whip-saws in the end.

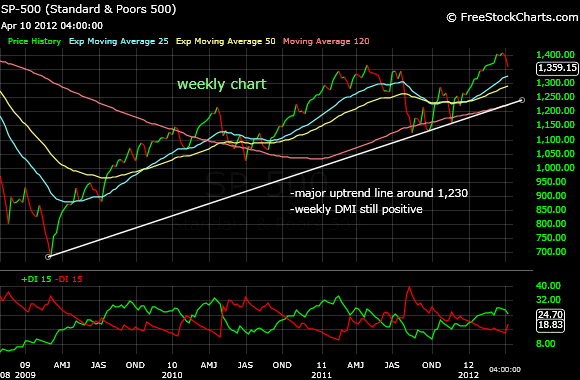
Market is now bullish on all time frames. We may see another attempt to establish another 4-year higher high, above 1,420. Market is just 20 points away from this peak. after that it's hard to anticipate what is going to happen next. One possibility is a repeat of last year scenario with market trying unsuccessfully to establish a 3 year higher high followed by a drop in August. However, the situation at the fundamental level is not exactly the same as last year. For now let's pay attention to this new "buy" signal.

Meantime I am going to play a little bit with individual stocks. I consider them more dangerous than the index ETFs but they may work pretty well if carefully chosen. I'll let market settle down a little bit before re-entering index ETFs.

One such individual stock is JCP. Yesterday the stock was upgraded and I noticed a possible change in trend. By coincidence the same pair of EMAs and SMA works well for JCP and SPX. I want to stress this out, when dealing with individual stocks one need to find the best pair of EMAs.

I like JCP since it trades very nicely both up and down so I can use EMAs crossing. If the stock is very volatile forget it, you cannot use EMAs. I'll look at other stocks in the next few days and I am going to let you know if I found something interesting.


Wednesday, April 25, 2012

AAPL wins the day

Huge rally today due to AAPL earnings and market is close to giving a "buy" signal on intermediate time frame. EMAs are touching but SPX is already above SMA 120. Tomorrow even a flat day will cause the EMAs to cross. 


The trouble is that we had too many "buy" and "sell" signals in a short period of time and this is an indication that market doesn't have a clear trend and most likely is going to trade in range in the near future (weeks or maybe months from now). The range so far is 1,360-1,391 but the range may get larger in time. If we are going to see the market moving down tomorrow that will mean that the upper edge of the trading range is going to act as resistance. However, if market establishes a clear higher high, in the 1,395-1,400 area we should expect further upside movement. Tomorrow is going to give us some clues, unless is going to end flat.


As I mentioned many times EMAs crossing doesn't work well when market is undecided, it works only when market is trading strongly up or strongly down. In times like this I usually switch to either 30 minutes or 2 hours chart using the same pair of MAs. 30 minutes charts give faster "buy" and "sell" signals but also generate a lot of whip-saws. 2 hours chart worked pretty well lately since it avoided the March whip-saw but gave a clear "sell" signal in April. If market is going to give a "buy" signal on hourly chart tomorrow I am going to wait for a confirmation on the 2 hours chart before going long again. I am going to lose a few points by waiting longer but is going to be safer this way. 


Friday, April 20, 2012

Undecided

SPX is giving mixed signals on intermediate time frame. EMAs are touching with a slightly bearish bias but SPX remains bellow declining SMA 120. So I am giving the benefit of the doubt to bears.


The week was won by bulls, they manage to recover 9 points. They were actually 19 points ahead on Tuesday after a 21 points rally but gave back 5 and 8 points on Wednesday and Thursday respectively, and today ended pretty much flat after bulls were pushing for 10 points in the morning. On short term bulls may attempt something as well next week. I notice two higher highs and two higher lows on short term. What bulls need is another higher high, somewhere above 1,395.


Long term remains bullish but there is a warning coming from weekly MACD. As you noticed weekly MACD captured all major uptrends and downtrends in the last few years. MACD is a little bit more sensitive than weekly DMI. Last time it gave a "sell" signal was in April 2011. As you remember back then market went widely up and down for a few good months before going solidly down so I can say weekly MACD gave the "sell' signal a little bit too soon. Right now it looks like is ready to give another "sell" signal. This is just a warning for bulls that are investing on long term. The "sell" signal may very well be cancelled soon, you never now.


For now I would say market remains slightly bearish with bears having the upper hand but not really in control.

Earnings and the situation in Europe are the major market movers. On Monday we are going to see the results of the French elections. If Sarkozy is going to lose as many political analysts predict, we may see the market down since apparently the business world prefers him. These are the rumors at the moment anyway.

Gold, another hot subject, is giving a bearish signal, we have now the so called "death cross" a cross between SMA 50 and SMA 200. Last time I saw a "death cross" on gold was back in 2008 when gold went from 900 to 700. The good news is that the multi-year uptrend line is still intact so a bounce up from this level is also possible at least on short term.


Friday, April 13, 2012

Second bearish week in a row

SPX lost today almost everything gained yesterday and market is once again bellow SMA 50 on daily chart. Daily DMI remains negative confirming the bearish momentum.


On hourly chart, there is no major change, we still have a bearish EMAs crossing and SPX is a few good points bellow a declining SMA 120.


Overall SPX lost 30 points this week. What bears want to see is a new low, bellow 1,359 level we saw two days ago.


Gold is giving mixed signals, with daily DMI slightly positive and weekly DMI in red. It is now very close to the 2009-2012 uptrend line so one may be tempted to buy a little bit here hoping is going to go at least to the upper edge of the "symmetrical triangle"formation gold is trapped for over a year. Of course assuming that the multi-year uptrend line is going to hold. The trouble is that gold is bellow both SMA 50 and SMA 200 and the two moving averages are about to give a bearish crossing the so called "death cross".


Thursday, April 12, 2012

Bullish action today...

...but the intermediate time frame is still bearish. Yesterday bulls managed to push SPX 10 points up but the action was not particularly bullish, they advanced in the morning then they gave up half of the gains by the end of the day. However, today the action was bullish, bulls started close to yesterday's close value then push SPX up and ended the day in a high note. Since the bearish momentum is higher right than it was a month ago the intermediate time frame is still bearish, we still have a bearish EMAs crossing and the index is bellow the declining SMA 120. Yet bears must be nervous here since they saw their little profit vanished more than once in the recent past after market seemed to go down just to see bulls recovering nicely in a matter of a few days.


To turn the table in their favor bulls need to gain another 10-20 points. That will probably be enough to make EMAs to give a bullish crossing, daily DMI to turn positive and SPX to climb above SMA 120 that is now around 1,398.


For now I remain cautiously bearish and wait for bulls to convince me they are serious in their attempt to make this market look bullish, once again, in every time frame.

babaro

P.S. I am interested only in hourly chart but faster players can use the same pair of EMAs but on faster time frames, such as 10 or 15 minutes charts. The problem with this faster time frames is that they are giving more whip-saws than the hourly chart and you need to spend more money on commissions since  you need to trade more often. The advantage is that in times when market is undecided they give better entry and exit points. Bellow is a 10 minutes chart that worked pretty well recently. The same with 15 minutes chart. according to this shorter time frames you were supposed to go long today around 1,375. The problem is that a down day tomorrow is going to give another "sell" signal at a level probably bellow 1,375.


Wednesday, April 11, 2012

Bulls trying something

Bulls pushed SPX this morning towards SMA 50 (1,376) but then moved down. SPX remains bellow the one week downtrend line, SMA 120 is declining and is far away and we still have a bearish EMAs crossing. So the intermediate time frame trend remains bearish. Bulls got more points than I anticipated due to Alcoa results and another successful round of treasure bonds selling. The day is not over yet but they are going probably to close somewhere around 10 points on the upside.


Daily DMI remains in red despite the 10 points advance. It need another 20-30 points on the upside to turn green.


4 pm update

Bulls managed to gain 10 points today but the intermediate time frame trend remains bearish. The action was not very bullish either, 15 points advance in the morning, getting close to SMA 120 and the downtrend line but then moving down and ending the day close to the lowest value. Obviously another 10 points on the upside tomorrow is going to create problems to bears but let's not anticipate. Tomorrow there will be another round of earnings with focus on Google but only after hours. In the following days we'll have WFC and JPM earnings but next week is going to be even more exciting with earnings from C, GS, INTC, IBM, YHOO, TXN, BAC, MS, TRV just to name a few of them. 

Tuesday, April 10, 2012

Nice confirmation

It's 2:20 pm and market seems to confirm the bearish trend started a few days ago. We may look at a decent correction here.


We have also the confirmation from 2 hours chart, EMAs also crossing and SPX bellow SMA 120.


Daily DMI it's deeply in red but weekly DMI is still positive. Once the weekly DMI is going to turn red we can talk about a change in trend on the long term time frame.


Let's see if bulls manage to do something by the end of the day.

4 pm update

Bulls could not do anything and bears win the day. This is the 5th day on the downside in a row. The next support level is around 1,345 the low we saw in March when we had the whipsaw. Market may initially bounce up a little bit from there. However, if SPX goes bellow 1,345 we may see a rapid drop to the next support level that is around around 1,280 (November's peak).


For now I am expecting market to calm down a little bit and allow the two EMAs to get closer to the price, meaning flat days, slightly positive or a little bit on the downside but not the magnitude we saw today. That's my guess based on previous market behavior.

Today starts the earnings season another reason the market will get volatile in the next few weeks.

Take care!

babaro

Monday, April 9, 2012

Bearish morning

Very bearish morning with SPX going down no less than 17 points at the moment. For the second time we have a bearish EMAs crossing and SPX bellow SMA 120. Last year at this time we had SPX going down almost 100 points two times in a row before market went down for good.


Please note that daily DMI has turned negative but weekly DMI is still positive. The long term remains bullish despite being bearish on shorter time frames. Also market slipped bellow the four months uptrend line.


4 pm update

Bulls tried something in the afternoon but they gave up by the end of the day leaving SPX 15 points down, close to the opening level.

Today's action looks more bearish than a month ago when we had a whip-saw. The drop was due to the not so good job data on Friday but market had only today the chance to react. On Friday all international markets were on red but today Europe end it mixed. A flat day or one on the downside tomorrow is going to give more confidence to the bears. What bears don't want to see is market jumping up tomorrow and recovering most of the today's lose like it did happen a month ago.

Take care!

babaro22

Thursday, April 5, 2012

No follow up...

... after yesterday despite EMAs giving a bearish crossing today. SPX bellow SMA 120 but SMA 120 is still rising. The bearish momentum is weak and we may see bulls recovering the lost ground in the next few days.


The fact that Feds were not too enthusiastic about QE3 two days ago gave bulls the reason to start selling but now probably they are trying to assess if this rally has legs in the absence of another round of QE. We'll see!


Wednesday, April 4, 2012

Some weakness...

... but bulls remain in control. Once again SPX moved bellow rising SMA 120 and EMAs are crossing a little bit on hourly chart. However, market found support exactly at the 4 months uptrend line. I don't want to get too enthusiastic about the possibility of seeing a correction here. We had a whipsaw not too long ago so I am very cautious right now. In my country of origin we have a saying "when you get burned by the soup you start blowing in the yogurt".


Tomorrow we are going to have a better picture of the market direction. Another day on the downside, with market plunging bellow the uptrend line is going to be significative. However, if once again we are going to see bulls jumping in the little bearish momentum built today is going to vanish.


babaro

Sunday, April 1, 2012

Bullish first quarter

SPX advanced no less than 12% this first quarter making one of the best since 1998. AAPL is responsible for 15% of SPX gain. Market is now bullish on all time frames. SPX showed a little bit of weakness yesterday when SMA 120 was challenged but bulls came out to the rescue by the end of the day and they pushed for another 5 points today.


We are entering the earnings season on April 10th when Alcoa is going to report its results. The expectations are pretty high so I am not going to be surprised if SPX is going to move further up.


Bulls are very well positioned and they continue to buy every single dip. The rally uptrend line is now around 1,390. This is the level we should watch at the moment. 

VIX continues to stay at a very low level but gained one point above the low seen a few days ago. 


Summer is usually bad for stocks so we may see a peak in April or May followed by some weakness over the summer and eventually another bullish leg starting in in the fall.