Thursday, June 30, 2011

Daily DMI on green

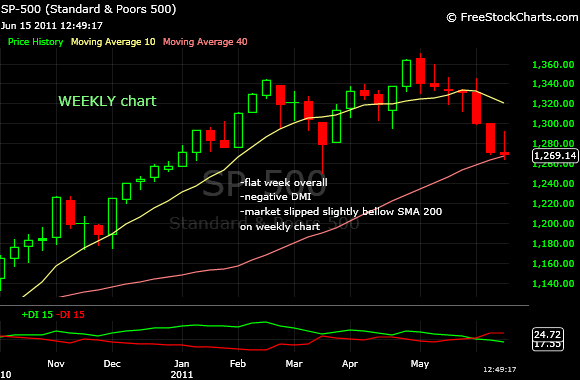
Weekly DMI still on red but not by much. However, yesterday daily DMI has turned positive.


Beware of the resistance around the downtrend line, around 1325 according to daily chart and 1322 on two hours chart.


Remember I switched to two hours chart a while ago since hourly chart gave me too many false signals. Most likely I am going to back to hourly chart for intermediate time frame signals but for now I am listening to EMa 25-EMA 50 crossing on two hours chart. These EMAs gave a bullish crossing yesterday at the same time with daily DMI turning positive. Market also above SMa 50. However, EMA 32-EMA 64 on daily chart still gives a bearish crossing and SMA 50 may still cross SMa 200 giving the so called "death cross". So, on longer time frames the bears are not done yet!


Monday, June 27, 2011

Weekly update

I said last week that I am getting conflicting signals from daily and weekly chart and as a result I was expecting a flat week but I had a bullish bias. Well... I was right until 2 pm on Friday when bears got hungry and pushed SPX another 7 points down, enough to bring the market a little down on weekly base.


For this week the situation looks a little bit different. SPX stays now exactly above SMA 200 and 2009-2011 rally uptrend line. Any move bellow this level is going to trigger a huge sell off similar to that seen last year on May-July. One could ague that market already lost 100 points from the top. That's true but slipping bellow SMA 200 is going to cause a loss of another 60-70 points before reaching a support level. My target on the downside is 1,200-1,220.


What is the level where we can say market slipped into a bear market once again? As you remember from older articles the support SMA for SPX during 2003-2007 bull market was SMA 75 on weekly chart (SMA 375 on daily). In terms of EMAs, the best pair that separated bull market from bear market in the last 20 years is EMA 20-EMA 40 on weekly chart (or EMA 100-EMA 200 on daily). If you look at the charts one may argue that this pair of EMAs did not give a good entry, it was pretty late. That's true but it's also true that during the May-July crash last year they offered a very good support, they almost touch and also price moved very close to SMA 75 but did not signal the beginning of a new bear market despite what many "gurus" argued at that time.


SMA 75 resides around 1,200 right now so this is the 2009-2011 bull market support level. There are no reason to panic yet. However, I want to mention that both EMA 20 and EMA 40 on weekly chart are pointing down and SMA 75 is getting a little bit flat, both signs that the two year rally is getting "tired".


Finally, I want to clarify something so I don't confuse you more than usual :)
I mentioned a pair of EMAs (32 and 64 on daily chart) as the one that describes 2009-2011 rally. I said rally, not bull market. While EMA 100-EMA 200 (on daily) is a pair that functioned extremely well for decades to signal the beginning or the end of a bull market, EMA 32-EMA 64 is specific to 2009-2011 rally and nothing more. It did give a bearish crossing at the end of May 2010 and a bullish crossing on mid September pretty much at the same level. The reason I am showing this pair of EMAs is to make you aware that we may a situation similar to May-July plunge.

First things first, let's see if SMA 200 is going to hold today or not.

all the best!

babaro


Thursday, June 23, 2011

"New" resistance levels

It's 11:30 am and market is moving down big time. I thought it may be important to let you know what levels we should watch from here, more exactly what are the resistance levels.

On daily chart you can easily spot 1,265, the last lower low made last week which also coincides with SMA 200. If this fail market may find support around 1,256 that represent the March low.


However, going bellow 1,265 is going to trigger a far bigger sell-off and 1,256 is not going to do too much to stop it. I am saying this because a move bellow this level not only crosses SMA 200 on both weekly and daily charts but also violates the most important uptrend line, the 2009-2011 bull market one that also resides around 1,265. So 1,265 is THE resistance level at this point.


Later on, time depending, I am going to show you at what level I would consider that the current bull market has ended.

Tuesday, June 21, 2011

Nice bullish action, afternoon update

Second day in a row with market moving up. SPX managed to back into the downtrend channel and even more important it looks like is going to make a higher high on daily chart. Well... the day is not over but it looks promising.


EMAs are almost giving a buy signal on hourly chart but remember that they didn't work so well in the last two months giving at least 3 whip-saws so one should look on slighter longer time frame, either the same pair of EMas on 2 hours chart or EMA 50-EMA100 on hourly chart. This pair of EMA gave a correct "sell" signal around 1330 and did not give any false buy signal since then.The trouble with longer time frames is that they are "lazier" than the shorter ones and make you enter or exit the market a little bit late. EMa 25-EMA50 worked better than any other pair over a long period of time. Right now doesn't work so well but sooner than later we'll stick with this pair once again. I'll elaborate this subject later.
 

Friday, June 17, 2011

Bears can't get the lucky 7

A flat week as I anticipated on one of the last week blogs with some decent action on both sides but ultimately the price remains at the same level as last week. Now the negative daily DMI has lost some of its strength which is actually good for the bears side keeping in mind that high levels in DMI signal overbought or oversold market.


Most likely market will stay flat next week as well but I do have a slightly bullish bias. No, is not a mistake, I said bullish not bearish bias. Why am I contradicting myself from one sentence to the other? Well... I am getting conflicting signals looking at the daily and the weekly charts.

On daily chart SMA 200 is around 1258, a very important support as usual so there is room for an extra 13 points drop without crossing this very important SMA. Then comes the daily DMI that got rid of the overbought condition as I mentioned above so we can have another drop without DMI making a higher high.


 On the other hand please have a close look at the weekly chart. SPX is almost touching the most important uptrend support line, the one that started in March 2009 at the bottom. This uptrend line resides around 1268, just 3 points bellow today's close. This is one of the most important support level so I expect the market to bounce up from 1268 next week.  The funny thing is that SMA 40 on weekly chart is also around 1268 so one more reason why this level is very important. I am sure you noticed that SMa 200 on daily chart is around 1258 and on weekly chart around 1268. So which one is correct? I don't know, I would go with the daily chart since it gets the value out of 200 bars instead of 40 bars on weekly chart but don't worry too much about this since plus or minus 10 points makes no difference. No only that but remember that I am doing visual estimates so I can easily be off 3-4 points at any time.

In conclusion, keeping in mind that daily and weekly chart don't agree about the direction of the market would be safer to say it will remain flat with a bullish bias due to the fact the uptrend line on weekly chart is a better support level than SMA 200 which is an arbitrary level that it's suppose to work any time and for any stock/index.


Saying that I wish you a nice week-end and all the best!

Next week I am going to look at a even longer time frame, at the pair of EMAs that indicated the beginning and the end of every bull or bear market in the last 20-25 years with a 100% accuracy. I talked about this pair of EMAs before so is not going to be a big surprise for those of you who read his blog almost every day.

babaro


Straddle on silver

Market tries to end this week in green but most likely will end flat.

Meantime I see a very good entry for a "straddle" on silver, strike price 35. The reason for this is that silver is pretty much trading in a range that gets tighter by day and "straddles" are getting cheaper and cheaper. Sooner than latter it's very likely that silver will go in either direction. You don't care if it's going strongly up or strongly down. The only way to lose money if it continues to stay in the 34-36 area. Anything above 36 or bellow 34 is going to make a nice profit.


The lower edge of the "triangle"  almost coincides with a very powerful uptrend line, the one that started on September 2010 at $18 per share!

By the end of the day I am going to make a weekly update on SPX and try to figure out what is most likely to happen next.

babaro


Wednesday, June 15, 2011

SMA 200, afternoon update

As expected SPX stayed pretty much around last Friday close. Granted market had a decent move on the upside yesterday and a even bigger move on the downside today but overall market is almost neutral this week.


The most important even that could trigger a huge move in either direction is the fact that we are very close to SMA 200. As you know computer trading represent a big percentage of the volume we are seeing every day and most computers more likely are programmed to sell or to buy the minute market touches SMA 200. On the first move, I expect market to bounce up as soon as SMA 200 is going to be touched. Usually SMA 200 is a good support level. On a second or third attempt, a move bellow SMA 200 is going to trigger a big sell off.

SMA 200 resides now around 1258 on SPX and 11,730 on Dow.


Sunday, June 12, 2011

Six weeks on the downside

Six consecutive weeks on the downside! Wow! I can't remember when was the last time I saw this kind of "performance". With weekly DMI clearly negative, market has more room to fell down. However, on a shorter time frame we may see a bounce up. Is not only the fact that SPX had its worse strike in 10 years it's also the daily DMI that has reached a pretty high level that makes me think we are going to see a move on the upside this week or at worse a flat week but overall, on longer time frames,  the bearish downtrend is more likely to continue.

 You know that my favorite pair of EMAs on 60 minute chart are EMA 25-EMA 50, with SMA 120 as confirmation. The same pair of EMAs works pretty well on daily chart as well. According to this pair of EMAs we have already a "sell" signal since they are crossing right now. However, one should notice that this pair of EMAs gave 3 small whip-saw since March 2009 bottom. That's not too bad but we can easily get rid of this whip-saws by increasing the value of both EMAs. If I am correct the lowest pair of EMAs that gets rid of the 3 whip-saws is EMA 32-EMA 64 on daily chart. Rounding up we can say EMA 35-EMA 70 is the best pair.


Looking at the weekly chart I noticed that market is 2009-2011 uptrend line.


 SMA 50 is pointing down right now for the first time in a year. SMA 200 is very close, just 10 points bellow the current level. Going bellow SMA 200 is going to be a big deal so expect at least some support around that area. 


Have a nice evening!


Thursday, June 9, 2011

Resistance

Bulls are trying to push SPX inside the downtrend channel with the lower edge around 1293. Let's see if they manage to climb above this level or above the May 18th low around 1,296. On daily chart the values for the upper and lower edge of the downtrend channel has slightly different values. After 6 6days on the downside and daily DMI touching a pretty high negative value it's not surprising that bulls are trying something despite relatively bad news today.

Let's see how days ends. I hope I'll be able to come back after closing and make a longer analysis.

P.S. Use the chat room bellow to leave a message for me or to other readers. If it's for the first time you are righting your message will appear only after I'll approve it. After that I am going to give you a permanent pass and you can write without my approval


Wednesday, June 8, 2011

Afternoon update

Weekly DMI has also turned negative on Dow, Nasdaq and Russell 3000. The only weekly DMI not yet negative is Russell 2000.

P.S. I am playing with a new "toy", a live board (you can see it when you open this page. Please leave a message to see how it works for you. I know it's working for me.


Tuesday, June 7, 2011

Weekly DMI has turned negative

Maybe Bernake is right and we are not going to see a double dip but expect further plunge from here. On of my major technical indicators, weekly DMI, has turned negative! Except for two minor whip-saws weekly DMI was a fantastic prognosticator of every major leg up or leg down.


Let's have a look further back, since the beginning of the recession back in 2007. As you can see weekly DMI gave an excellent exit point around 1450 on SPX. The bounce up from the bottom was very fast and weekly DMI turned positive only around 900. Still good enough to capture 550 points on the short side. After briefly turning negative on June 2009, weekly DMI turned positive and stayed that way until January 2009 when again turned briefly negative. In May 2010 did turn negative big time signaling a major plunge (May-August). At the beginning of October it did turn green signaling a long rally that probably end it yesterday.


Extreme lows or highs on weekly DMI are also good indicators of "overbought/oversold" levels. Remember in February I told about an excessive high on weekly DMI. A week after that SPX suffered a pretty violent plunge from 1340 to 1250.

Since I am talking today about market on the long range let's have a look, again, at the pair of EMas that did signal the beginning or the end of every bull market in the last 20 years. I am talking about EMA 20-EMA 40 on weekly chart (EMA100-EMA 200 on daily chart). As a confirmation I used SMA 75 on weekly chart. SMA 75 is now around 1,200 so we should look at that level as the best support level. If SPX goes bellow 1,200 in the next few weeks we are back to the bear market. EMA 20 is slightly moving down but EMA 40 is flat at this point so on long term market is still safe on the bullish side.

On daily chart it's obvious that SPX went outside of the downtrend channel. We are probably going to see attempts to climgb above the lower edge of the channel.


All the best!

babaro22

P.S. Don't forget to add a comment!

Monday, June 6, 2011

The case for UNG

How many times did you hear that the natural gas has hit the bottom? Personally I hear this everyday since UNG hit $50, two years ago. Meantime price has plunged further down to 12 after going as low as 10.
This time it may be true. There are good technical signals that UNG is at or very close to the bottom.


Most important of all is that the weekly DMI has turned positive for the first time since ... July 2008 when UNG was around 90!!! This is a very long time! Looking back on the chart the best pair of EMAs that didn't get a false "buy" signal is EMA 8-EMA 16 on weekly chart or EMA40-EMA80 on daily chart. On weekly chart they are crossing a little bit, not convincing but the crossing is there. We also have the price above SMA 32 (weekly), the moving average that functioned as the best resistance level in the last 3 years. SMA 32 corresponds to SMa 160 on daily chart but also notice that UNG is above SMA 200.


Just to let you know, I am buying a little bit right here and I reserve the bulk of the buying after I'll have clear signals. I'll keep a very close eye on this ETF!

Wednesday, June 1, 2011

50 points swing in the last two days

After jumping above the upper edge of the downtrend channel yesterday SPX plunged no less than 30 points today! Now the question is if the lower edge (1,305 as of today) is going to resist the selling pressure. 1,305 is also the level where bulls expect a pretty decent support on SPX (see the daily chart).
Interestingly, the level were market found support today, 1314 was touched no less than 4 times since May 23rd.


Traditionally summer is a bad omen for stocks so staying short or out of the market until August-September is not going to be such a bad idea.

Since market was very choppy in the last 2-3 months EMAs crossing on hourly chart did not work very well so I had to consider either a slightly longer or slightly shorter time frame. Since I am exclusively in options right now I do prefer shorter time frames (same pair of EMAs on 30 minutes chart) but if you don't fancy trading too much I think going to two hours time frame instead of one hour is going to work well. On "FreeStockCharts.com" you can chose 1,2,4 hours time frames. If you are using a different program that doesn't allow you to plot your chart on 2 hours time frame just use the one hour time frame and double the values of the moving averages, EMA 50-EMA 100 plus SMA 240 as a confirmation.


 Daily DMI tuned red after going slightly green yesterday.

Daily chart offers more details about the current market conditions but I'll talk about that tomorrow.


Have a great evening!

babaro