Saturday, September 29, 2012

A week on the downside...

... but the long term bullish momentum remains intact (actually is the second week in a row on the downside). 


So, should the bulls worry about this? Well, it depends on what time frame they are trading, if they're trading on long term they have nothing to worry about (yet) but the intermediate time frame looks neutral at the moment with EMAs almost touching  and SPX barely above rising SMA 120. However, we had a similar situation at the beginning of September and nothing happened, bulls pushed SPX another 60 points on the upside. 


Daily chart shows a DMI barely positive, with a 3 months uptrend line climbing to 1,415. This is a very important level for those trading on intermediate time frame. Between 1,400 and 1,420 we have a decent volume both during the August-September and March-april periods. 


On the upside there is not too much resistance ahead, the only significative volume at this level occurred only 4-5 years ago. 

With QE3 starting soon bulls may push market further up before a significant drop. I don't think the enthusiasm around QE3 is over due to the last too weeks market ended in red. More likely, as I warned you in previous posts market cooled off a little bit since it went ahead of itself. Remember when SPX was over 30 points above EMA 50 on two hours chart I warned you that the market was overbought in short term and a cool off was expected. 

However, if you are in the bears' side let's look at a possible scenario, market moving bellow the 3 months rally uptrend line (around 1,415). At exactly the same level (1,415) we find SMA 50 on daily chart. From the previous two big corrections we can easily see that the drop bellow SMA 50 (but also with SMA 50 starting to point down) was the "kiss of death". I will think about this scenario if I see a sudden move on the downside next week, or market rising to 1,467 then moving down again 20-30 points. A higher high (above 1,480) will cancel the bearish scenario. But, as usual, let's not anticipate too much!


Gold and silver finished flat this week after a nice rally. The long term is definitely bullish at the moment with weekly DMI clearly on green. Please also note the "golden cross" on both gold and silver.


Let's have a look now at VIX. Well, what can I say about VIX rather than that it's at a very low level but slightly above the April's low? This looks bearish but keep in mind that VIX can go even lower than it is at the present time. During 2005-2007 rally it stayed around 10-12, a good percentage bellow the current level. 


However, since its peak in October 2008, every time VIX hit a low, it didn't last for too long, market undergoing a significant correction. Since VIX it's so low a smart move would be to buy volatility here (I think there is an ETF called VXO for this purpose). 


Even if market is going to go further up for a while,  VIX won't go too much down but a correction is going to send VIX spiking. Another good move in my opinion could be buying some straddles on index ETFs or individual stocks that tend to go with the market. A straddle means buying a "call" and a "put" at the same time, so you are both long and short. Since you are hedged, the risk is minimum. However, if volatility spikes your "put" is going to appreciate at a much faster pace than the losses suffered by your "call". You can't lose more money than the cost of the call but your "put" has unlimited gain potential. 

Have a nice trading week!

All the best!

babaro

Tuesday, September 25, 2012

Finally some action

One dissident in Fed's camp who spoke against QE3 sent the market down 15 points. Despite the sizeable drop market remains bullish on intermediate and long term. On two hours chart SPX crossed both EMA 25 and EMA 50 but is still above SMA 120 and there is no EMAs crossing yet. 


One hour chart didn't help me in the last four months (too many whip-saws) but I look at it from time to time. It's interesting that market found support today exactly at SMA 120.


On daily chart I am looking at the most obvious support levels and these are 1,420 (April's peak) and even most important 1,410 (the four months uptrend line)


Weekly chart shows that the long term remains bullish, with weekly DMI on the positive side and the 2009-2012 rally uptrend line around 1,310.


I am not convinced by today's action. Probably market players used the Fed speech as an excuse for some profit taking. If this is going to be serious we are going to see the market dropping even more for the rest of the week and intermediate time frame turning bearish.

The stocks I picked in previous posts did pretty well, especially CYTX (39% up), HL, XNPT, HOV (all 11-17% up). Among the losers, MCD which climbed 2.3% and I picked it as a stock good for shorting, PCP (1.8% up) on short list as well. The "weekly DMI" stocks also performed pretty well. Maybe I am not as bad as I thought at picking individual stocks :)  Please note that I put these stock on my list 1-2 days before I presented them to you.

babaro

Thursday, September 20, 2012

Stocks with positive weekly DMI

As I mentioned many times when weekly DMI changes from negative to positive or the other way around the long term time frame becomes positive or negative. This is true for the general market, for index ETFs. However, it doesn't work that well for individual stocks. With this in mind I am presenting you a list of stocks that recently switched from a negative weekly DMI to a positive DMI. These are stocks you can have in mind if you are trading individual stocks. Obviously with individual stocks the technical aspect is not sufficient, you also need to look at the fundamentals, you need to research the stock to see if they are going to announce something soon (like a new product or earnings) and most important you need to have a good stomach to "digest" potential huge fluctuations up or down. I also tried to best fit the data to the best EMAs to be easily for you to spot an uptrend. Obviously if weekly DMI turns negative you need to exit the stock.

Here are a few of these stocks. There are many more that switched from negative to positive weekly DMI. In another post I am going to present to you stocks that switched from positive to negative weekly DMI.


Sunday, September 16, 2012

QE3

After Feds announced the new round of quantitative easing market moved even higher than last week, establishing a new higher high.


I expect market to move further up on long term but it may cool off a little bit on short term since I see market 23 points above EMA 25 on two hours chart, a sign that market is overbought on short term.


As expected dollar was smashed after QE3 announcement and precious metals rallied. With weekly DMI turned positive for both silver and gold I see these metals moving further up for a while. Silver may not reach its top around 50 before a correction but gold may go back to 1,900 without hesitation.


Metals and mining rallied as well this week (CLF, X, WLT) but as I said last week they look technically very weak. One stock that looks good technically is CENX, with price above downtrend line and weekly DMI just turned positive.


Some of the stocks I mentioned last week (HL, CYTX) rallied and those I said looked vulnerable didn't perform so well, especially ORCL, but MCD didn't break bellow the support level yet despite the presence of the "death cross". Please note that these stocks are looking good or bad on weekly charts meaning that it may take weeks until a predicted pattern may form.

One stock I forgot to mention last week, a stock that stays on my "watch list since September 6 is HOV.


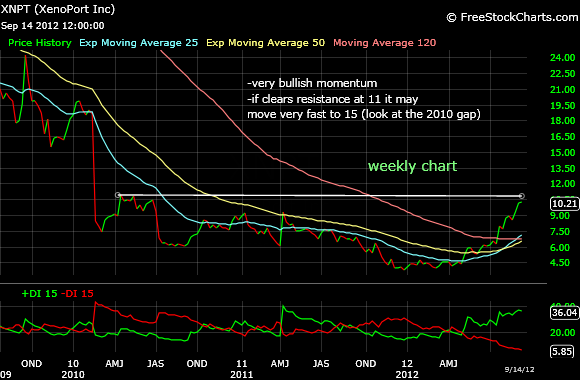
XNPT also looks pretty good at the moment, especially if manages to pass some resistance around 11. after that there is a huge gap towards 15 and gaps tend to be filled very fast.


All the stocks i mentioned above as good "buys" have the advantage that they offer a good entry at a low price (all they were hammered in the recent past) but they have the disadvantage that you may get burned, what it seems now as a change in trend may look soon like a trap. If you really want some stocks that are going to be bullish no matter how the general market is doing consider BIIB and LEN. Of course the disadvantage is that you need to enter at a high price but they are safer than the stocks I mentioned above. Once again I am going to mention that I am rarely trading individual stocks, I prefer index ETFs but I avoid 3xETFs for reasons I am going to tell you in another post soon.


All the best!

babaro


Saturday, September 8, 2012

Bullishness

SPX has turned bullish in all time frames. Yesterday's good news gave bulls ammunition for pushing SPX above the resistance level around 1,420. With this level cleared SPX is pushing towards 2007 peak around 1,550. Nasdaq has already passed the 2007 level and Dow is also getting close to its 2007 peak. 


Weekly chart shows SPX above both rising SMA 50 and SMA 200 and a clear higher high. DMI is rising again and remains on green.


Daily chart shows SPX clearing the 1,420 level as I mentioned above. SPX needs now to consolidate above 1,420 for this level to become a support zone in the future.


Meanwhile the 2 hours chart shows SPX above both EMAs that are rising once again and above rising SMA 120.


Not too much remains to be said about SPX, all time frames are bullish and more bullishness is expected. 

Metals and mining stocks moved very powerful today with CLF and MTL rising not less than 15%. X, AKS, WLT also moved 7-8% today. Technically, all these stocks look awful but if you want to take a risk and invest at a good price maybe you should think about. 

Personally, I avoid individual stocks, I consider them very risky compared to index ETFs but I know many people disagreeing with me. If you want to risk very little you can choose two stocks from the same industry and go long with the stock you like and go short with the one you don't like (say MTL and WLT). If you are right you will have a small profit. If you're wrong you'll have a small loss. this strategy works well for extremely cautions people. 

After screening a few hundreds stocks I came out with this list of stocks that look to me as good buys and a few that I think need to be shorted. I don't own any of these stocks.


I am neutral on HOG, on one hand we have a very strong multi-year uptrend line that makes the stock jumping up every time is touched, on the other hand we have a "death cross" and a weekly DMI on red.


Three stocks that after an excellent run look "tired", MCD, ORLY and PCP.


There are many other stocks out there that look good technically. I may complete the list in a following post if are really interested in purchasing individual stocks. Please let me know.

All the best!

babaro

Sunday, September 2, 2012

Hesitation at the top

Hi guys, long time not seeing you (I've been in a long vacation), I hope you all did very well on stock market and made a lot of money!

SPX moved up 50-60 points since my last post, not bad, but moved more or less sideways since August 6. With Feds saying that they are not against another round of QE bulls may have the best excuse to push the market above the key 1,420 level. However, this is not a done deal, and SPX barely moved 7 points on Friday after the news. 

Daily chart shows SPX around the same top, 1,420, seen at the beginning of April and the three month uptrend line stands around 1,380. DMI is just barely on green so market looks neutral on this chart.


Weekly chart looks more bullish than the daily chart with weekly DMI now on the green side (yet is moving down right now) after staying in red for a few good months in a row and SPX making a slightly higher high. Also bullish long term is that both SMA 50 and SMA 200 are rising again.


Hourly chart looked very choppy in the last three months not very useful from timing point of view but 2 hours chart looked pretty good with only one minor whip-saw. The two hours chart shows SPX above rising SMa 120 which is bullish but please notice that the two EMAs are very close to each other, almost touching which is neutral on intermediate time frame.


Gold and silver on the other hand reacted strongly at the possibility of a new QE and advanced no less than 2.5% on Friday. Both metals are at their strong momentum since their top at 1,900 for gold and 50 for silver. I say this because gold moved above the major downtrend line for the first time in a year. Also the weekly DMI has turned positive. The "death cross" is still present but GLD managed to move above both SMA 50 (rising) and SMA 200 (flat).


A similar scenario for silver that managed to break outside a very long downtrend channel and has the daily and weekly DMI on the positive side. 


All the best!

babaro22