Monday, January 31, 2011

"Sell" signal needs to be confirmed

EMA 25 did cross EMA 50 today despite the 10 points gained by SPX! Price is almost 3 points above SMA 120 and DMI is still neutral so the sell signal needs to be confirmed tomorrow and for the rest of the week but my main signal has turned bearish on intermediate time frame. The system added another 80 points after giving a "buy" signal at 1205.


I am amazed by the perfect resemblance (so far) with April's 2010 market action, huge rally, a sharp move down (points 2 to 3), a multi-day move up making a higher high (3 to 4) then immediately making a lower low (4 to 5), short move up while EMAs gave a bearish crossing (5 to 6). Meantime SMA 120 was crossed a few times up and down (SMA 120 on hourly chart corresponds with SMA 19 on daily chart). While this may be very well a coincidence what is maybe worth noting is the "diamond top" pattern we had in April 2010. Compare the numbers 1 to 8 on both cases and you will notice that they perfectly correlate. Even the number of days it took this pattern to form on both cases is the same. It took 10 days to reach point 5 in both cases. Let's see if the market is going to also add the last two steps, 7 and 8, meaning another couple of days moving up and down SMA120 then the start of the actual correction.


As I told you in the past I am not a big fan of patterns I show you this more for entertainment.  What it is important for me at this point is to see the two EMAs moving further apart, daily DMI to turn red and once the market turned bearish I want to see EMA 120 at a safe distance from the price, not like last time, in November, when it was challenged 3-4 times immediately after EMAs crossed.

So, my biased opinion is that the intermediate time frame has turned bearish and nothing can prevent a correction at this point. As I warned you in the past this timing method is not perfect but statistically speaking the chance that a EMA25-EMA50 crossing signals a real shift in market direction is very good, from previous experience I would say 75-80%.

All the best!

babaro

"Sell" signal today?

SPX is fighting to get above SMA 120 at this moment (1283.5). EMAs are touching each other, maybe crossing a little bit if you zoom in, but it's too close to call it right now.


Anyway, if SPX stays like this (1283) or is closing bellow 1283 we may see a "sell" signal. Ideally the market needs to close flat or a little bit in red to get a good "sell" signal. If this happens we are going to see a confirmation from daily DMI that is slightly green at the moment. Let's not rush! Patience pays!

I'll come with more updates later.

2:25 pm update

Bearish EMAs crossing despite 7 points on the upside. If market closes bellow SMA 120 (1283.5) the "sell" signal is going to be confirmed.


babaro

Friday, January 28, 2011

Are we there yet?

Today was the most bearish day in the last two month. We had a lot of bad news, the most important probably being the GDP growth that was bellow expectations. Then we had AMZN and F that plunged after earnings and MSFT in not such a good position either. Not to mention that market was overbought on short term and yesterday bulls were in denial and pushed the market up despite relatively bad news from T and PG.

Has the widely anticipated correction started? Most likely the correction has started but I need to see a bearish EMAs crossing before going "all in". Better safe than sorry. Unless market goes up by a lot on Monday the EMAs are going to cross each other. Ideally, I want to see market moving up a little bit and an EMA crossing at the same time. That will give me a better entry on the short side.

I don't know what is going on with the software today, I am getting a weird chart when plotting on "hourly" (looks like market closed at 1299 which is wrong, of course) so I am using 30 minutes chart instead and doubled all the moving averages, I am looking at EMA 50 crossing EMA 100 and SMA 240. As you can see price moved bellow SMA 240 but EMAs did not cross yet they are as close as ever in the last two months


In terms of support and resistance levels, market failed to find support at short term support levels around 1286 and 1277 (barely missed this one) or at intermediate time frame support around SMA 120 (1282 today). I also noticed that SPX made a lower low on daily chart, it went bellow the previous low at 1281. It's not a dramatic lower low but it's there.


Market never behaves the same but I won't be surprised to see a "dead cat bounce" next week as we saw in April 2010.


SMA 120 could be crossed above and bellow but EMAs are not going to cross up and down at the same rate. That's why I do favor EMAs crossing over SMA 120, because EMA crossing is something that happened once in a while so the chance of a whip-saw is lower than with SMA 120. It's true that SMA 120 gives a better entry when the market violently moves down but most of the time this is not the case.

A flat or a down day on Monday is going to generate a "sell" signal. Keep an eye on that!

Have a nice weekend!

babaro


Very bearish morning

Despite the negative news (AMZN, F, MSFT, lower GDP growth than expected) market went up in the morning but it changed its mind half an hour later.

This is the most bearish move since the beginning of this leg. SPX slipped 5 points bellow intermediate time frame support at 1282 (SMA 120). EMAs did not cross yet, the move was too violent, but they may cross by the end of the day or most likely next week.


I'll keep an eye on daily DMI as well. Right now is slightly green but is probably to turn red soon.

P.S. Three coffees today. thank you bears :)

Thursday, January 27, 2011

Dow did not respond to earnings today

Before the market opened I expected Dow to go down and Nasdaq to close flat or a little bit up. This is because two of Dow components missed the earnings, T and PG and jobless claims went up last week. Instead I saw a run towards 12,020 on Dow. VIX is almost at it's lowest value in 4 years. This plus the fact that SPX is about 17 points above SMA 120 makes me think market will cool down a little bit on short term.


On intermediate and long terms market looks very solid. I haven't noticed any bearish move in the last few days. Some people may argue that Dow tried twice to close above 12,000 but failed. I won't put too much weight on this fact right now. I would be impressed seeing Dow touching 12,000 then at least a mini-plunge intra-day. That would be something.


Dollar went down a little bit but gold also went down. EMA 35-EMA 70 seems to be a good pair of EMA for those trading gold on long time frame. I went back to 2006 on weekly chart and they worked well back then as well. Gold is moving very close to the support around SMA 150 and EMAs are pointing down but no crossing yet.


A new round of earnings tomorrow morning and after hours today. AMZN is down 10% as I am writing this and MSFT earnings were not impressive either. The most important thing is how market is going to react to tomorrow's earnings. Are we going to see another discrepancy between earnings and market move?

P.S. Thank for the "coffee", whoever bought it for me today. It was delicious :)

Wednesday, January 26, 2011

Higher high

SPX made a higher high today, nothing spectacular, just one points above the previous one but the fact is that once again market looks bullish on all time frames. However, I won't be surprised to see a small pullback on short term since price is now 17 points above SMA 120, a little bit too much after such a long rally. I was looking for some signs of bearishness, a small intra-day sell off after SPX touched 1296 or when Dow hit 12,000 today but none of them happened.


Dollar took another hit after Feds decided to leave the rates unchanged.


Tomorrow we are going to see another round of earnings. In the absence of any Obama's speech or Fed meeting, earnings should be the only fundamentals driving the market. T, CAT, PG, all Dow components are going to report before market and these earnings are suppose to move the market up or down. MSFT and AMZN are going to report after hours.

Very frustrating days for bears that are waiting on the sidelines to go short but it pays to wait for a sell signal than trying to guess the top.

All the best!

babaro


Tuesday, January 25, 2011

Flat day...

...but a lot of action, SPX went down as low as 1281, just two points above SMA 120 then recovered all the lost ground in the last hour of trading and ended flat.


So, here is the deal. When a trend is starting we are expecting that trend to continue, that's the whole idea behind "momentum trading". The intermediate time frame I am interested in turned bullish at the beginning of December, around 1205. From that moment on it was bulls' job to prove they have enough "ammunition" to keep the uptrend intact, meaning higher highs and higher lows on daily chart, positive DMI, no EMAs crossing and market above SMA 120 on hourly chart. At this point all the pressure is on bulls, they need to prove that there is still room on the upside. They need to make a higher high on daily chart, a close above 1296, they need to keep SPX above SMA 120. There is less pressure on bears, they don't need to prove anything since the trend does not belong to them. If they manage to do some "damage" in meantime is good but is not absolutely necessary for this trend to lose its bullishness. As soon as this market is going to turn bearish (WHEN is going to turn bearish) all the pressure is going to be on bears. They need to prove that they can keep market at a safe distance from SMA 120, they need to push market lower and lower, making lower highs and lower lows. Last time the intermediate time frame turned bearish bears didn't do a good job. SMA 120 was crossed just a couple of days after the sell signal was generated, then it was challenged another 3 times in less than two weeks. Not only that but they could not push the market bellow 1175-1180 in four attempts.


When the "buy" signal was generated in December the uptrend was very clean. Price stayed at a very comfortable distance from SMA 120, EMA 25 and EMA 50 were not even challenged until December 15th. This is how a healthy uptrend or downtrend looks like. If you look at the price movement last year (see "Happy New Year" article) you will notice how clean all the uptrends and downtrends were.

Coming back to the present situation, we had a nice rally since December 1st, SMA 120 was not even once challenged until January 20. That was the first warning that the uptrend is getting tired. However, if you look at EMAs they were never in danger to cross each other. Intermediate time frame remains bullish but bulls need to prove to themselves that there are still room to move up.

Monday, January 24, 2011

Some hope for bulls, morning update

Bulls are starting well the week, SPX up 6 points as I am writing this. Price moved above both EMAs that are slightly rising now. There are two resistance levels, one at 1286 that was overcome this morning and another one around 1289, the two month uptrend line.


The most important thing is if SPX manages to make a higher high on daily chart, a close above 1296. That will give bulls hope that the leg on the upside is not done yet. Any decent move down from a level bellow 1296 is going to work on bears favor.


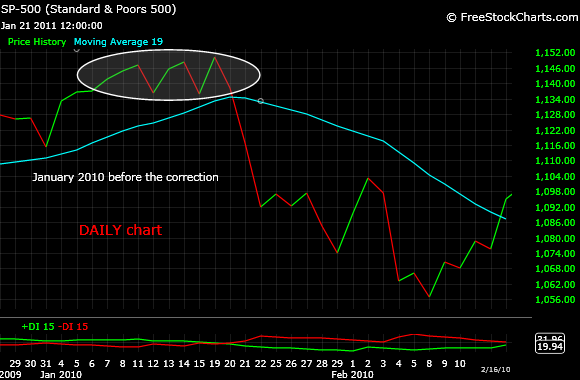
It is important how the market closes today and for the rest of the week. It is possible to see the same pattern we saw at previous temporary tops, June 2009, January 2010, April 2010, August 2010, small moves up and down from one day to the other (see previous post).

I'll keep an eye on EMAs crossing and SMA 120, neither of them being close to a "sell' signal at this moment.

Saturday, January 22, 2011

What's next?

A very good day to trim the longs since market's action looked pretty bearish. We had a mini-rally in the morning due to GOOG, AMD and GE earnings, then the market went down and ended up pretty flat. Market seems to lost the "fuel", not even a series of very good earnings is able to move it forward. The only index that remains bullish is DOW that made higher high today due mostly to GE 7% jump on the upside. All other indexes, SPX, Nasdaq, Russsell are bellow January 18th high. 


Looking at hourly chart I can see both EMAs being flat at this moment and SPX 8 points above SMA 120. There is no EMAs crossing so no "sell" signal yet.


On short term two levels seem to be important, 1277 and 1286. By Monday SMA 120 is going to climb up to 1276-1277 so this level is going to be a support for both short and intermediate terms.

Dollar moved down again and is probably going to stay low as long as the Feds keep the interest rates close to zero.


When market touches temporary tops it tends to move one day up, one day down for a few days before collapsing. This is just an observation, not something one can trust as a buy-sell signal. Next week we are going to have a better picture of market players' intentions. There is a very good chance I am going to get a "sell" signal soon but I am not going to act, not going to go short before I can actually see the sell signal. On long term market remains bullish.


babaro

Friday, January 21, 2011

Reversal?

Watch out for a possible reversal. If market close in red today after very good earnings from GOOG, AMD and GE and after rallying 10 points in the morning the chance for a decent downtrend increase significantly. At the fundamental level there is no reason for market to go down so the only explanation left is that all the good news are already baked in the market and bulls are willing to take their profit here.


The most important level remain SMA 120, 1274 right this moment. Let's keep an eye on this level and of course on EMA 25 and EMA 50.

GOOG is down despite the very good earnings, another warning sign.

babaro

Thursday, January 20, 2011

A serious warning!

A flat day, as expected, with market waiting for Google and AMD to report their earnings this afternoon and GE, BAC tomorrow morning. SPX has touched SMA 120 in the morning for the first time since the beginning of this leg, in December.  This is a serious warning for those trading based on intermediate time frame momentum but the most trusted signal is still EMA 25 crossing EMA 50. 

SPX has a short term support at 1277, we need to watch this level but even more important is the support around SMA 20, 1273 today.


On daily chart I notice that SPX moved a little bit bellow the seven weeks uptrend line.


Dollar went up a little bit but it didn't manage to climb above SMA 70 on daily chart and we are still have the bearish EMA s crossing.


Gold and silver got crashed today but this didn't change the long term 
trend that is bullish.


Tomorrow is going to give us a lot of clues about which direction the market wants to move. Earnings were not bad for neither GOOG nor AAPL the largest companies to report this week. If market continues to move down despite GOOG earnings that is going to be a sure sign that a correction is going to happen right now.  If GOOG and AAPL can't move the market up nobody can do it. Just as a curiosity, last year the correction started on January 20! Last year we had bad news, right now the news are not so bad but after rallying 200 points many bulls need only an excuse to take some profit of the table.

Watch SMA 120 tomorrow (probably around 1274-1275) and more important watch the charts to see is EMA 25 is going to cross EMA 50 or not.

Have a nice trading day tomorrow.

babaro

Wednesday, January 19, 2011

Largest one day drop in two months

Pretty severe move on the downside today, no less than 13 points drop on SPX making this the largest one day drop since the middle of November. The short term support around 1286 didn't hold but the one around 1277 did. Price moved bellow both EMAs but is still above SMA 120, today around 1273. Intermediate and long term time frames remain bullish. 


On daily chart please notice that market found support at the 7 weeks uptrend line.


The weak dollar didn't help the market today. Yesterday market went up a little bit on three bad news, today plunged on two good earnings (IBM and AAPL) and a bad one (GS). 


VIX has spiked 9% but remains very low. 

EBAY reported good results today, after hours,  LUV, MS and FCX are reporting tomorrow before market opens. I don't expect market to move too much tomorrow since most of the people are going to expect Google's earnings and they are going to come out only after hours. 

Friday is probably going to be a very interesting day, market is going to digest Google's earnings, we are also going to hear from GE and BAC and in top of that it's the option expiration day.

Have a nice evening!

Tuesday, January 18, 2011

Weird trading day

Citi and Delta missed the estimates, AAPL went down on Jobs' health concerns but market went up! Doesn't make sense! Even more weird VIX went also up today. If bulls pushed the market up today on bad news what are they going to do tomorrow in light of the very good earnings reported by IBM and AAPL after hours?

I am not surprised that market is going up now, at the beginning of this earning season, since this is how it has behaved during previous earning seasons but not going down even a little bit when major companies misses estimates it's a sign of irrational bullishness. I may trim some of the longs here but I am not going short unless I see market bellow SMA 120 and a bearish EMA25-EMA50 crossing. I don't want to argue with the market.


SPX is once again 24 points above SMA 120 which sits today around 1271.


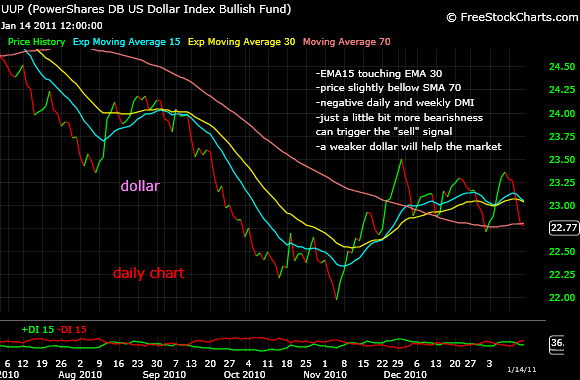
Dollar went down today is giving a weak "sell" signal, EMA 15 is slightly crossing EMA 30 on daily chart. 


By the end of this month the majority of the big companies are going to report their earnings. In February we have only XOM, A, PFE, V, MA (and probably a few more big companies I missed) but the core of the earnings is going to end next week. A rise towards 1320, a level I mentioned many times in the recent past (see "volume at price" indicator) it's very possible keeping in mind this extremely bullish momentum. After that... I don't know, remains to be seen.

Monday, January 17, 2011

Is AAPL going to bring the market down?

It's 4 pm and European and Asian markets went down today. However, US futures are not down that much, only 4.5 points on SPX. It will be very interesting to see how AAPL shares will do tomorrow morning with news about Steven Jobs' poor health. On the bright side AAPL earnings are expected to look very good. Even more interesting it will to see how the general market is going to react if AAPL shares are going to go down. My impression is that market is hugely overbought at least on the short term time frame. When this happens market players only need an excuse to take some profit off the table.


Earnings for big companies are expected to look very good, the real reason why market went up so much lately. Judging from past earnings seasons I would expect market to move up for another couple of weeks before a decent correction but who knows, tomorrow AAPL may trigger a long expected correction.


SMA 120 is going to climb from 1269 to 1272 tomorrow. This is the most important level for me and other people that are trading on intermediate time frame. Once again, let's not anticipate next move just be prepared in case market is going to slip bellow key support levels.

Friday, January 14, 2011

Seven straight weeks rally

Last time we had 7 up weeks in a row was in May 2007! This is an incredible bullish momentum. On the other hand any resemblance with 2007 peak is worrying. Are the last comers going to get burned again?


VIX has slipped bellow April's low. At least a little correction is unavoidable but how high are bulls going to push SPX before that? My guess, based on "volume at price", is somewhere in the 1300-1320 area.


The short term remains hugely overbought with SPX no less than 23 points above SMA 120 but this doesn't seem to bother the bulls too much, SPX  stays at the overbought level since the beginning of December.


Market was also helped by a weaker dollar today. Dollar is at a crossroad, it's very close to triggering a "sell" signal. A weaker dollar is going to help the bulls and probably the "gold bugs" too. Today precious metals were down despite the weak dollar but I don't try to speculate too much on this fact.


Next week is going to be extremely interesting with some of the big guys reporting the earnings, GOOG, AAPL, MS, C, GE. These are market movers so I expect big moves in SPX each day one of these guys are reporting their earnings. In the past market rallied in the first 3-4 weeks of the earning season, when the strongest companies usually report, and crashed after that. It could happen again by the end of this month, but this is just a guess. It's better to stay with the trend and to be fully hedged especially when the trend lasted for such a long time.

Market is closed on Monday, so we are going to come back to the "trading desk"s on Tuesday which is going to be a hell of the day with AAPL, C, IBM, WDC, DAL among the companies reporting their earnings.

Don't forget to leave me a message. I want to hear your opinion!

Have a nice weekend!

babaro

Wednesday, January 12, 2011

Bullish on all time frames

A fresh two year high today after an 11 points rally. DMI is now bullish on all time frames and it's really hard to argue with bulls here. How long is this leg going to go up? Who knows! We can only guess.


As I mentioned many times in the last few weeks "volume at price" indicator over the last 5 years, when SPX was exactly at this level, shows a huge volume in the 1220-1320 area with the highest value around 1280. It doesn't mean SPX is going to going to stop here, it means the resistance is higher around this level that it was until now. This is in theory but from the market action in the last few weeks I can't say I saw any resistance from 1220 to 1285 despite the high volume at this price in the past.


What bulls should worry a little bit is that VIX is very low, it's actually as low as it was in April 2010. It can go lower than this (in October 2007 was around 10) but this low value indicates than bulls are getting a little bit too enthusiastic.


A potential bearish warning is a huge negative divergence in MACD. The negative divergence is also present on weekly chart but is not as obvious as on daily chart.


I used many indicators and oscillators over the years, I looked at trend lines, different patterns (head and shoulder, wedges, symmetrical triangles), at candlesticks, negative or positive divergences... you name it. They all have their merit but in terms of reliability none of them are coming even close to EMAs crossing and to the confirmation I am getting from daily DMI. I hope this year I am going to be more disciplined than last year and listen carefully to my EMAs. Saying this, I am not going to go short until I see EMA 25 slipping bellow EMA 50. IF I am going to gamble a little bit and go short before EMA crossing I am going to go very "light" with some SDS shares but I am going to buy some "puts" to hedge my position. Since VIX is so low options are cheap. Since it's the earning season I am also speculating a little bit on "straddles (buy a "put" and a "call" at the same time and gain if the underlying security has a strong move either up or down). With straddles the risk is low since you are long and short at the same time but from the same reason the gains are not spectacular.

Have a nice evening and a profitable trading day tomorrow!

babaro