Sunday, October 4, 2015

A nice break

Pretty exciting week, especially Friday, when market reversed intra-day. These intra-day reversals are significant on short/intermediate time frames especially when market tries to make a fresh lower low or a fresh higher high but fails. We had a failed rally after the Feds announcement that they were not going to rise the rates, SPX flied to 2016 just to turn red by the end of the day. After that, we saw a fast drop of more than 100 points. On Friday, SPX did not actually attempt to make a fresh lower low (that would be bellow 1865) so is not that significant but, nevertheless, a 60 points rally after a decent drop in the morning can't get unnoticed.


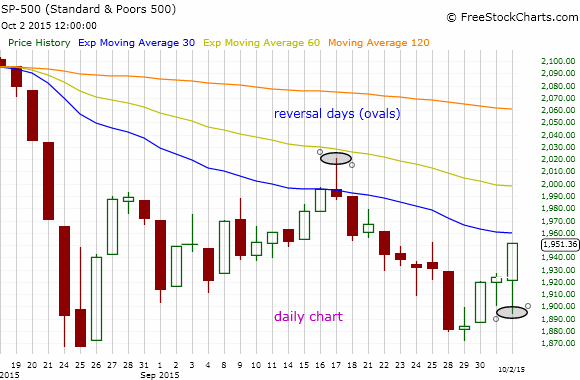
The most important fact about this reversal day was that it did cancel a fresh lower low on weekly chart and a drop bellow SMA120. It doesn't mean bulls are now in control of the long term, it just means bears are taking a break here.


I want to be clear about what I mean by long term, I mean a significant move on the upside or downside noticeable on the weekly chart. The reason I am making a big deal about the long term is because SPX moved bellow EMA60 for the first time since 2011. Not only that but SMA120 was also crossed a few times (granted by the end of the week price moved above SMA120). Also both EMAs are pointing down, again a pretty rare event. Obviously, the longer time frame out there is the one that defines the bull market. From this point of view SPX is still in the bull market. Why is this important? Because as long as the market stays in the bull territory is can still make a come back. However, once the bear market starts there is no way back until market suffers a substantial loss, beyond 20%.

I hear people (even authors on Market Watch) saying SPX may go to 1,700 then back to 2100. This is very naive! At 1,700 SPX is going to be in a bear market for sure. From there it is extremely likely that it will go further down, God knows by how much. It will eventually go back to 2100 and above  only in a few good years from that point. It took SPX five years to get back to 2007 highs. 

I've seen people arguing that indexes have been in red for 3 quarters in a row. Actualy, this is not acurate. The only index that had 3 quarters in red is Dow, SPX had only two (first was rather flat than red) and for Nasdaq this is teh first quarter on red. 


Officially,  recession starts when the economy (not the stock market) finishes two quarters in a row in red. However, don't forget that the stock market anticipates what the economy will do in the near future. Stock market enters the bear territory a few months before the recession is officially declared and starts a new bull market a few good months (around 6 months) before the end of the recession becomes official. Stock market started going down in November 2007. Recession was officially declared in July 2008. Stock market entered the bull territory in March 2009, long before the recession was officially over.

The fact that the economy seems to do good at the moment is not a reason to argue that no bear market is in sight. Remember that Wall Street insiders have connections with the people in charge of the economy. They know that the economy is starting to falter long before the rest of us do. There is a reason why market moved strongly down after August 24th. 

Now let's summarize this article to be sure you've got my point;

1. Very long term is still bullish --- we are still in the bull market
2. Long term is bearish ----- strong drop after August 24th, market making lower lows and lower highs
3. Intermediate time frame is neutral----- market traded mostly in the 1,915-1,990 range in the last 30 days.
4.Short term bullish----however, this may change in one single day.

 Generally accepted rules for a bear market to happen:
1. Fundamentally, economy needs to have negative quarterly GDPs in a row.
2. Technically, market needs to drop at least 20% from the top and stay there for at least six months.

My strategy in determining that a market has technicaly entered a bear market:
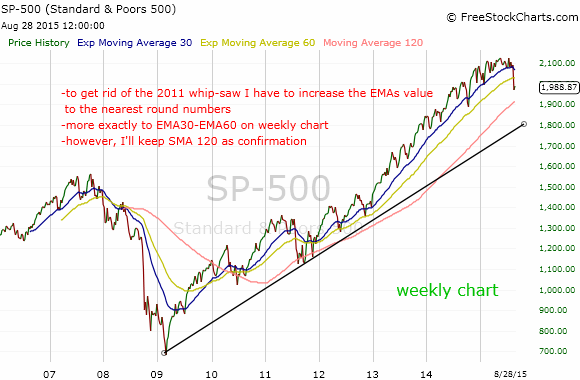
1. EMA30 crosses EMA60 from above (weekly chart)*
2. Market goes bellow SMA 120 on weekly chart
3. Market goes bellow a well established bull market uptrend line.
4. All three main indices (Dow, S&P500 and Nasdaq) fulfill all of the above conditions.  

*I usualy use EMA25/EMA50 pair but I've got a whip-saw in 2011 so I pumped the EMAs a little bit.

According to generally accepted rules no index is in a bear market neither fundamentally nor technically.

According to my strategy Dow is the only index that is almost in a bear market, it is bellow the bull market uptrend line and bellow SMA120. EMA30 is touching EMA60 but no crossing yet. 

All the beast!

babaro


Friday, September 18, 2015

As expected

No surprise this week except the market behavior after the announcement that rates won't be increased. I expected a big rally after 2:30pm yesterday. However, market rallied indeed but closed on red by the end of the day. Not only that but it continued to plunge today. Anyway, I've got rid of my long positions and now I'm mostly in cash and a little bit in bonds.

As I said last week, in my opinion, the reason market plunged in the last 30 days was not due to rumors that Feds may hike the interest rate, it was due mainly the weaknesses seen in the emerging markets, China in particular. 

Here is the paradox, a rate increase, despite the fact that the Wall Street was going to hate it on short term, it would have been signaling that the economy was doing fine. During the 2007-2009 bear market, Wall Street pushed the market up after each rate cut. However, one month later we could see market bellow the level was seen at the time of the rate cut announcement. Exactly the opposite was seen during the 2003-2007 bull market, every rate hike was met by a small plunge but after a few weeks market was eventually above the levels seen at the moment of the announcement.

Today we are in a very weird situation, the Feds are keeping the interest rates close to zero despite the huge stock market gains in the last 6 years. This is actually a very bearish signal, it says that the economy is actually very fragile and can't deal with even a small increase in the interest rates.

These are uncharted territories and one should be very careful at this point. A rate increase today after 6 years into the bull market and SPX gaining 200% since 2009 bottom is not the same as hiking rates 1-2 years into the rally. 

Anyway, let's have a look at the long and intermediate time frames.

On long term what is noticeable is that SPX did not made a lower low this week. Actually it went up a little bit. Not very surprising keeping in mind that SPX did approach a serious support level according to my timing method (SMA 120 on weekly) and it was the week when the Feds decided not to increase the rates. 


Long term bearishness is still in play! We are still in the bull market but we need to be very cautious at this moment. 

On intermediate time frame it's easy to notice that SPX went briefly outside the trading range. However, by the end of the day SPX was still in the 1915-1990 range. 


In conclusion, market remains volatile on short/intermediate time frames but bearish on longer time frames. We are still technically in a bull market but  keep in mind that this kind of bearishness was not seen in 4 years. Remember that you don't need to be invested in the stock market all the time.
Your first worry should not be how to make more money but what should you do to NOT to lose money. One way is diversification (including cash and bonds), other option is having STOPS in place. There are pros and cons in favor or against using Stop-Loss or Stop-Limit orders. I am going to touch this subject next week. My favorite way to protect my longs or my shorts is to buy options. This is a pretty complicated subject for those with little experience in the market but I'll do my best to simplify the issue. 

See you next week!
Once again, don't be a hero, be conservative with your investment at times like these ones!

Safe trading!

babaro


Friday, September 11, 2015

Very little change

A week with a bit of gains but this doesn't affect the long term at all. More exactly, after making a lower low last week we saw another lower high this week. It is possible to see a fresh lower low next week that is going to put bulls in an even worse situation that they are already in.

However, the decision to not raise the rates this month is more likely to lift the market pretty dramatically, at least for one day. If the gains are going to hold or not... this is a separate issue. Market is not down at the moment due to rumors that the Feds may increase the rates, is down because China and the emerging markets are in trouble and because some European economies are struggling as well. A rate increase will give bulls one more reason to trim their shares so I don't think this is going to happen.

Technically, market is looking pretty bad at the moment. If SPX it's going to plunge bellow the bull market uptrend line (around 1,800) the panic will set in and more likely we'll going see the beginning of a new bear market. 


This week is going to be decisive for the long term. A close bellow SMA 120 would be a very serious warning in my view and one bellow 1,800, not necessarily this week but at any time in the future will be THE sell signal. But let's not anticipate. Once indexes are touching very important technical levels they tend to bounce first even for a short period of time. 

To get rid of this long term bearishness bulls need to stop SPX making lower highs and lower lows on weekly chart. A close above 2,000 will do the trick according to the weekly chart.

On shorter time frames, hourly chart, it looks like SPX is not going anywhere. Despite these crazy intra-day or day to day swings, SPX has traded for more than two weeks in the 1,915-1,990 range. Any close above or bellow this trading range would be significative on intermediate time frame. 


In conclusion, market most likely will remain volatile until Feds meeting. Once the decision is going to be in, 99% chance they won't raise the rates, market will make a decision and most likely is going to go out of the trading range one way or the other. 

Even if the market is going to rally on intermediate time frame, without a clear higher high, meaning above 2,200 on SPX, the long term bearishness will be there. I repeat, I haven't see so much long term bearishness in 4 years. Personally, I am mostly in cash and bonds and only 10-13% in stocks. I may very well sell everything into a potential rally.  

Take care! Be safe! Don't be a hero, this is not the right time!

babaro

Friday, September 4, 2015

Lower low on weekly chart

Bulls and bears are exchanging insults on every financial board at a rate I haven't seen for a while. This is due to the huge volatility we have these days that makes market swinging strongly in both directions so everyone is right for one day and wrong the next day. What makes me laugh is they are bragging about huge gains one day then, if next day they are losing everything plus change they are arguing they are in the market for the long term.

I hope you are not joining the chorus no matter if you are a bull or a bear at the moment since arguing with other people is making your blood boiling and you are very likely to make wrong moves.

Market is doing about the same as last week, it made a lower low on weekly chart on all indexes (or indices if you prefer this version, both are correct by the way) except Nasdaq where the lower low is present but is not as convincing as one on Dow or SPX. So technically this week is more bearish than the last week despite the fact that today market is above the low seen on Monday, September 24th.


The bull market uptrend line is around 1,800 at the moment, so if you see a big move bellow this level next week that will be a very bad sign. Keep in mind that the uptrend line is moving up at a rate of 15 points per month more or less, so if SPX is going to move up on short term or trade sideways for say another 3-4 months from now and only then move bellow the uptrend line, that line is going to be in the 1,845-1,860 area.


On a shorter time, like on an hourly chart, things are neutral at best if not bearish. SPX managed to make a higher low but failed making a higher high. For this market to turn bullish on this time frame SPX needs to climb to 2,020, which is 100 points above today's close. Not an easy task and even it is going to happen next week it won't affect the long term bearish momentum.


Another point I would like to make is that you should use a logarithmic chart if you want to understand the magnitude of move up or down compared with similar situations in the past. A 200 points move down from 2100 to 1,900 is not the same percentage wise with a 200 points move from 1,200 to 1,000 on SPX. On an arithmetic chart they will look exactly the same.


The recent drop is worse than the one seen on October last year, about the same with one in 2,010 but less that the drop in 2,011. However, don't forget the recent wave down may not be over.

To give a clearer picture of a difference between logarithmic and arithmetic charts look at this 1975-2015 chart. In 1975 SPX was around 50, in 1995 was around 450, a (9 times increase). In 2000, at the top SPX was around 1,500, about 3 times higher than it was in 1995. However, from the arithmetic chart you may believe that the 1995-2,000 period has the most gains.

 Look now at the logarithmic chart.


In conclusion, market remains vulnerable on long term and neutral to bearish on shorter time frames. A good idea at this point is to trim the stocks and move into bonds. If market is going to move a little bit up from here you are still going to make money with bonds but if the market turns ugly the loss will be substantially less with bonds. Personally, I have some money in a very good bond mutual fund, FGMNX, one of the few bond funds that actually increased in value even during 2007-2009 bear market.

All the best and safe trading!

babaro22

Friday, August 28, 2015

Huge volatility, bearish momentum, still bulish long term

The title is a summary of the stock market as of today, August 28, 2015.

So we had a crazy week with SPX swinging about 150 points just to end up 20 points above last Friday close. On short term probably bulls managed to get a temporary bottom. On long term market remains bullish, or more exactly we are still in a bull market. However, the bearish momentum created in the last 10 days it's a big warning sign for bulls. They should not take this drop lightly despite the last three days on the upside. 

Among many indicators, monthly MACD, that has a pretty good record at signaling the beginning or the end of a bull market, it's showing a bearish signal. 


Monthly MACD had also two whip-saws in the last 20 years so you need to keep in mind that is not perfect. My EMAS adjusted for monthly chart (considered a month as equal to 4 weeks, therefore I divided al MAs to 4) had no whip-saw during the same period (give me some bricks to beat my chest -))

Well, actually in 2011 EMAs gave me a faint bearish crossing for a few days but it was not confirmed by SMA120 which fell bellow the SPX value in a very short time. 


 You must understand these EMAs I have found for SPX are not 100% accurate. Someone asked me a few days ago why EMA50 and not EMA 48 or 51? Of course it doesn't matter which one of these I am using, I used 50 just because it was the closest round number. It cracks me up when I hear people predicting that Dow will collapse to say 11,254. Really? When you do a prediction you need to use round numbers, 10,000 or 11,000 or you can go somewhere in between, 11,500.

Anyway, let's adjust a little bit my EMAs to get rid of this whip-saw. I'll go to the nearest round numbers EMA30-EMA60. It's ok if you do this kind of fine tuning once every 5-10 years. Otherwise, if you change them all the time just to look good in front of other people, you are just kidding yourself and lose money at the same time. So, from now on (actually from 2012 on) I am going to use this pair instead of EMA25-EMA50. This will give me a "sell" signal (like in "the beginning of a new bear market") at a lower value on SPX that the other pair but it will be more likely to generate a real "sell' signal not another whip-saw. I don't see any reason to change SMA120 to a higher value.

So here is how the new pair of EMAs look like. No big difference I must say. 


Another thing I want to mention for the people who are not part of the old followers is that I prefer SPX to any other index, either Dow or Nasdaq. However, no matter what signal I am getting from SPX I want to be be confirmed by the other two indexes. 

For example, at the moment Dow is the most bearish index since is the only one that went bellow the 6 years bull market uptrend line. At the same time Nasdaq is the most byullish. SPX, as usual, stays somewhere in between.


In conclusion, if you are long don't panic yet but be alert since I haven't see this kind of bearishness in awhile. Protect your gains with "stop-losses". Personally I hate stop-losses (I am going to tell you way some other time) and I prefer to protect my shares by buying "puts". 

All the best!

babaro22


Wednesday, August 26, 2015

Bear market?

Not yet! This is the most bearish momentum since 2011 but technically we are not yet in the bear market. At least according to my timing method.


For those of you new to my blog I am going to write a few words about my timing method. Basically is an improved version (I'm bragging, of course) of MACD. I am using exponential moving averages crossovers in order to get "buy" or "sell" signals. I mostly use two exponential moving averages (EMA) EMA25 and EMA50. Why these two? Because I noticed that they are giving me the best "buy" or "sell" signals with the least whip-saws (fake buy or sell signals). As a confirmation I am also using a single moving average (SMA120).

Using this pair of EMAS on weekly charts it gives me a clue when a new bear or bull market starts. I am always missing the exact top and the exact bottom but I can safely take advantage of a good chunk of a bear or bull market without fretting every single day that I may lose my money.

For example the "sell" signal came at the beginning of 2008 somewhere around 1,300 on S&P500, a few good months before the October crash. The buy signal was not that good or it seems this way because market went down from 900 to 650 then back to 900 in a very short time and EMAs didn't not had enough time to react to this sudden move. The buy signal was somewhere around 1,150. Actually not bad keeping in mind where are we today.

Coming back to August 2015 I see S&P500 (SPX) sharply bellow EMA50 for the first time since 2011 and also slightly bellow SMA120. EMAs are pointing down but not crossing yet. These are serious warning signs. We are not technically in bear market yet but I'm afraid this is not a "buy the dip" moment either. The bull market uptrend line is around 1,800, very close to today's level.


If you are in for the long term you should not panic yet. It's hard to believe market will go straight down from here. Most likely bulls will push SPX up a bit even if is going to be short lived. When this happens maybe a good idea is to buy one "put" for every 100 shares you own just in case SPX is going to plunge into a bear market. Options are expensive now but they are going to be much cheaper if SPX moves up even a little. Let me know if you are not familiar with options so I can give you some advice.

All the best!

babaro

P.S. I am adding two charts for AAPL. Judge for yourself if the signals generated by my method are better than "death cross", "golden cross". You may say it's easy to look back and find the best pairs of EMAs. It's exactly what I am doing but only ONCE, based on a long run in Dow or AAPL or whatever stock I am interested in, then STICK with that pair. In time (years) I may adjust them a little bit if I am getting an whip-saw but they will be close to the initial values.


A close up to see the current prices.