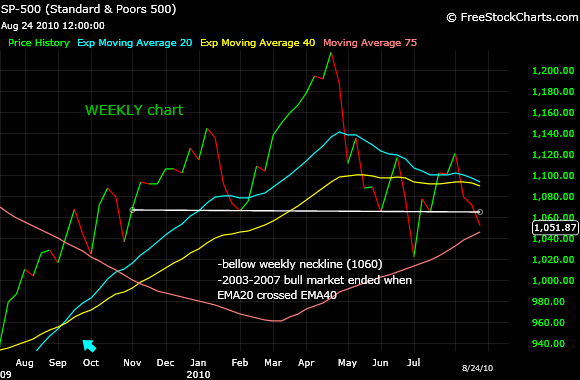
Another bad day for bulls with SPX plunging bellow the weekly "neckline" around 1060. The last line of defense seems to be now 1040-1050. Bellow these values we should expect new lows, bellow 1,000. Once again my major buy/sell signal, EMAs crossing, worked well (1090-1,100 wasn't such a bad level to go short).
As I mentioned before, 2003-2007 bull market was roughly defined by EMA100 crossing EMA200 (or EMA20/EMA40 on weekly charts). Once EMA100 crossed EMA200 from above the market didn't look back and plunged to 667. For SPX and Russell 2000/3000, SMA75 on weekly charts was also the support moving average. Where is SMA75? It stays around 1045 so a move bellow this level is going to send very bearish signals. EMA20 is very close to cross EMA40 (on weekly charts). This is a long term perspective to understand the general direction of the market but for the sake of making profitable transactions you should pay attention to EMAs crossing. Forget about anything else, if you follow these buy/sell signals you are going to make money even on times like this when market trades more or less in range.
babaro


No comments:
Post a Comment
Thank you for your feed-back