Friday, July 30, 2010

Finally an up month

I found a little bit of "free" time to write a few words today.

The good news for bulls is that SPX managed to claim this month. The bad news is that the bullish momentum seems to vanishing and DMI is about to turn red unless bulls manage to push the indexes up next week. It's good that the uptrend line (around 1093) provided support in the last two days but I want to see SPX above the resistance level around 1105 and DMI staying on green. It will be really upsetting to see indexes slipping back into the trading range. Personally, I don't care if market rallies or plunges but trading in range is killing me since I am getting whip-sawed most of the time.


Long term players should keep an eye on SMA200. A close above this value and a higher high above 1130 is going to be very bullish.

Have a nice week and remember I won't be able to write anything since I am going to be on vacation but I won't be upset seeing that some of you clicked on the adds and bought me a coffee or two :)

All the best!

babaro

Wednesday, July 28, 2010

Bellow SMA200 but 1005 level did hold

SPX lost a few points today but 1105 level did hold. Bulls should not expect this 3 weeks rally to continue without interruption, there is an uptrend line that already made two nice lower lows (ellipse) and two higher highs (cyan rectangles) and price tends to come back to their uptrend line before going further up. The problem is that SPX can't go down to its uptrend line right now because if it does is going to go bellow the key 1105 level and DMI  is probably going to turn red again. If this uptrend is going to be for real I do expect SPX to go up tomorrow and for the rest of the week since this is the only way to keep DMI in green.


The uptrend line is too steep to be sustainable on long run. Is not impossible to stay this steep (just look at February-April rally) but is very hard.

Have a look at EMA50 and EMA200 instead of SMA50 and SMA200. The difference between SMA and EMA is that EMA puts more "weight" on the most recent data. EMA50 is rising and is about to cross EMA200.


Just to summarize, I do trust bulls more than bears at this point despite the obvious short term overbought condition. Keep an eye on 1105 level and even more important on daily DMI that needs to stay in green.DMI on hourly chart did turn red a little bit and it needs to turn green today.

babaro

P.S. This may be the last article this week. Also next week I am on vacation so take care and I hope you'll have a nice trading week. I am always happy when I hear people saying they made money either long or short. All the best!

Stocks with volume and price quickly moving up

You may check my blog every morning for a list of stocks that are quickly moving up both as price and volume. The list includes stocks from "Standard and Poors 400 MidCap" and "Standard and Poors 600 SmallCap" stocks.  Here is the list for today.

CASY, DSPG, BWLD, CPKI, CRDN, EHTH, ODFL, AFFX.

These are usually fast moving stocks that are better suited for traders with high tolerance risk. Chose those that show the best fundamentals and have the best looking charts. For examply, technically speaking,  I would chose ODFL (above SMA200, no resistance ahead) over EHTH (bellow SMA200, just made a lower low).


Monday, July 26, 2010

DMI consolidates

Here is my 11 cents opinion (that's how much I made from my AdSense adds today :), DMI continues to consolidate its position so it's increasingly likely that we are going to get out of the trading range for good. Nothing is for sure in the stocks market, you already know this, but you need to bet on the direction that has the highest probability. Keeping in mind the good tracking record of daily DMI we should expect more upside movement from here. Sure SPX is not going to move in straight line from here but I trust today's break of the 1105 resistance level more than I did it in June. The difference? You guessed right! It's called DMI. Back then SPX started moving down before DMI had the chance to turn green. When are we going to have a down day most likely DMI  won't change red again. That is going to be a good entry point for some reluctant bulls.

Another well watched level was touched today, SMA200. We are talking here only about 2 points on SPX so is not that significant right now but it can become significant in the next few days so long term players who use SMA200 as a timing method prepare to get in. 


Hourly chart doesn't look bad either, DMI is positive, price is above a rising  5 days SMA and you can easily notice EMAs crossing.


Playing devil's advocate I am redirecting you to yesterday's article where I posted a chart with "volume at price" indicator that not only gives you the price levels where most of the volume occurred in the past but also tells you how much of the total volume belongs to bulls and how much to the bears. Looking at the chart you will notice that bulls outpaced bears almost 2:1 which means that this level (1100) is a better resistance level than a support one. We already passed this level so now it should act as a support but my point is that you should expect this level to offer less support if this market is going to go down than the resistance you saw it when the SPX was bellow 1100. This is the bearish scenario but at this moment I do favor the bulls over the bears. My skepticism comes from the fact that I was humbled by this market many times and I like to present both faces of the coin even if I do favor one of them. Every single day I am seeing people absolutely sure that market is going either up or down and I know for a fact that I am either dealing with newbies or with people investing for a while but too full of themselves to admit they could be wrong. Maybe this attitude make them winners in this aggressive World where we are living but in stock market stubborn guy pay their arrogance with their own money.

babaro

Sunday, July 25, 2010

Daily DMI slightly green

Very bullish week. DMI turned positive for the second time and it is possible that we are going to get out of the 1050-1105 trading range for good. Still I want to see SPX above 1105 before thinking about a possible long term leg up from here. Remember, money can be made either long or short so the least biased in any direction the better. Let's see SPX above 1105 and above SMA200 first!

Notice two support areas, around 1065 and 1050 and the resistance line at 1105. We do have an incipient uptrend line. Of course we need more points to build a nice uptrend line but it looks promising so far with too lows at 1022 and 1064 (or better 1072) and two higher highs, 1098 and 1102.


Price moved above both SMA50 (the "orwellian" 1984) and EMA50 (1092), still bellow SMA200 but above EMA200. What's the difference between Simple Moving Average (SMA) and Exponential Moving Average (EMA)? A simple moving average, say SMA50,  adds all the closing day values then divides the sum by 50. There is a potential big problem with computing data in this manner, every day of the last 50 has an equal weight (importance). However, if in the last, say 10 days, market made a big move the move is not going to be that obvious by looking at SMA. This abnormality is corrected by EMA that gives the recent data more weight. The majority of the people, especially older traders, still stick with what they learn first, SMA, that's why you will rarely hear anything about EMAs. Personally, I find EMAs more meaningful, especially when I am looking at moving averages crossing each other.

This is the most bullish momentum since the beginning of the plunge, in April as evidenced by the daily DMI. Most of the time, once DMI changes direction is stays that way for a long period of time. Sometimes, it gives first a warning, moves back to the old direction then gives the real signal. The warning and the actual signal are spaced only a few days apart. The only time this is not true is when market is trading in range (look at November-December 2009 trading range). If this market is going to slip again in the 1050-1105 trading range you will see DMI turning negative one more time but if you see DMI consolidating its bullish position and no turn to red in the next few days we are finally going to go see a decent leg up. DMI is not perfect but for me at least is the best indicator. When the signal is fake it only last a few days. I found this indicator by testing 50+ indicators and oscillators. You will hardly see people even mentioning DMI on their book or their website but everybody who tried it at my suggestion said is has improved their trading by a lot.


This is a turning point, whoever wins the daily DMI wins the the next leg.

"Volume at price" indicator shows that most of the volume happened around 1100 so this is a very important support/resistance level.


Have a happy trading week!

babaro

Thursday, July 22, 2010

The triangle is almost complete

The downtrend line and the support line at 1050 are almost colliding so the "triangle" pattern is pretty much complete. From now on the downtrend line does not represent a reasonable support level since the price is going to hit the support line at 1050 before hitting the downtrend line. The action was bullish this week  and unless tomorrow market is going to plunge bellow 1064 the bulls are going to claim this week in their favor. The trouble is that there are no good support levels so it takes only a major company to miss the earnings to bring the market down.


The best "support" for the bulls is the momentum as evidenced by the daily DMI that one more time is ready to turn green. On daily and especially on weekly charts DMI changing direction is a pretty rare event. Bears got an "warning" 10 days ago when DMI turned briefly positive. If DMI turns green again there is a very good chance that the long term momentum is going to turn bullish for good. On bears' support comes the fantastic resistance level around 1100 and the fact that we continue to trade in range for exactly two months (we are approaching the upper edge of this trading range). If bulls manage to above 1105 I think long term players (who should be out of the market since market is bellow SMA200) can move in since another conquest of the SMA200 level in going to happen in a much more bullish context compared to a month ago because at 1113 (SMA200) DMI is going to be very bullish. Very cations long term players should wait for weekly DMI to turn bullish. The trick is to wait for these events to happen then to react. I know this strategy didn't work lately (because it's a momentum strategy, therefore you're getting whip-sawed in a trendless market) but most of the time, on the long term, market is trending either up or down so I think is useful.

The highest volume in the last two months happened around 1060-1070. This may prove to be an interesting support level despite the fact is not that obvious when looking at charts unless you look on weekly charts where you can see a multi-month support line around 1060.


babaro

Tuesday, July 20, 2010

Bounce up from the downtrend line

Some interesting development this week. The downtrend line seems to hold well, not only that but we saw a bounce up today. Daily DMI still negative but is clearly losing momentum so even a modest climb up may "convince" the DMI to turn green. I put a lot of weight on daily DMI more than on any other indicator. The number of false positive or false negative signals is pretty low. Once DMI changes direction most likely will stay like that for a while. We may find some false signals especially after powerful bull or bear rallies. Then DMI may change direction for a couple of daysjust to move back in line afterwards. However, if DMI changes again direction against the main trend that is most likely going to be for real. Translating this information to the current market IF daily DMI turns positive again most likely is going to be for real. Most of the time daily DMI  changes direction for good. Some times, after a powerful run in one direction DMI briefly changes direction, giving a warning that the main trend may change. DMI turns in the direction of the main trend just to give up in the next few days this time for good.


For this momentum to go up it is necessary that for SPX to make a higher high, above the 1098 high established on Thursday

On 60 minutes chart we can see the hourly DMI turning negative before switching to positive again. This is the 4th signal in less than 5 days. In all fairness, that's how hourly DMI is supposed to behave, a good buy/sell signal after the market experienced a powerful trend up or down, then a lot of "whip-saws". It worked better than anything else in the last 60 days but this may come to an end. It is not supposed work as a timing indicator but as a confirmation signal for other indicators.

Have a look at some bad stock that are kicking right now pretty well: AKS, X, HOG, JCP,
 GNK.  I am preparing to buy AMLN "straddle" that has it's volatility shrinking. Look at both SVI and the Bollinger Bands that are shrinking, the calm before the storm. SVI stands for Shaffer's Volatility Index, it is designed to spot diferences in volatility of a certain stock. It's an invaluable tool for option players. 


babaro

P.S. Good luck with your trading. I am playing "straddles" during earnings season. I am making money risk free since the I am both long and short on the same stock (via options) and just wait to see a big move either up or down after earnings announcement.

Monday, July 19, 2010

Around the downtrend line

SPX moved slightly above the daily downtrend line but keeping in mind these are visual estimates let's consider the index AT the downtrend line, neither above nor bellow. Neither this move nor the one on Friday were unexpected, although Friday drop was a little bit more than I anticipated. The first scenario I laid out last week, SPX goings towards the downtrend line then index bounce up is back in business. What is encouraging for bulls is that DMI on 60 minutes chart is rather neutral than negative after today's 7 points up.

Nobody seem to be extremelly confident here, neither bulls nor bears. Practically the market didn't move since May 24, a huge volume in the 1067-1105 area and two brief escapes to 1022 and 1120. Bears have the advantage of SPX trading bellow SMA200 but bulls made some good progress lately, most notably climbing above the downtrend line last week and even more important daily DMI briefly turned positive. Very hard to call this market on long(er) term.


babaro

Saturday, July 17, 2010

Bellow the downtrend line

Once again SPX moved down bellow the downtrend line. As I mentioned the previous days I expected a pullback towards the downtrend line since the move on the upside was too fast and market was overbought on short term. Unfortunately for the bulls, the downtrend line did not hold. The downtrend line was around 1072 in the morning but it climbed down around 1069 by the end of the day so SPX is about 4 points bellow this level (these are visual estimates so consider them plus or minus 3-4 points). I am not going to make a big deal about this especially keeping in mind it was the Friday expiration week  and things are always getting weird, people are forced to close their option positions or at least to roll them over but if market close down again on Monday by more than 10 points is not going to be nice for the bulls.


Bears must be happy now that SPX slipped bellow the downtrend line and DMI on 60 minutes chart turned negative. This particularly DMI proved to be a very accurate timing indicator lately. Usually it gives some false buy and sell signal and the only DMIs I am regularly using are those on daily and weekly time frames but in the absence of the EMAs crossing that whip-saw me for 3 times, DMI on 60 minutes proved to be very accurate. Fast players should also know that EMA50 crossed EMA100 on 15 minute chart giving a "sell" signal, an information that is generally an early warning about the beginning of a new trend or the end of another. Usually I buy when the same moving averages crosses on 30 minutes chart.

I made a killing from 1220 to 1080 ( I must admit I played options). However, since the beginning of June until now  I barely managed to get even. Faster player probably rode all these spikes  but not me.
I keep mentioning to pay attention on EMS50 crossing EMA100 on 30 minutes chart, with crossing on the 15 minutes charts as an warning and those on 60 minutes as the confirmation of the trend. From now on I am using only 60 minutes charts and switched the EMAs to EMA25 and EMA50 (which is equivalent to EMA50/100 on 30 minutes charts) so you can watch both the hourly DMI and EMAs crossing on the same chart.


Please revise the 3 scenarios I wrote yesterday. We are still slightly at number one assuming SPX climbs above downtrend line on Monday. If not 1045-1050 should provide a nice support and a bounce from there will give bulls plenty of ammunition to climb above the downtrend line once again. The downtrend line and the horizontal support line around 1050 will meet soon and usually, when this event happens market violently moves in one direction or the other.

babaro

free counters

Thursday, July 15, 2010

Flat day

Bullish reversal day with no particular significance since the market has already advanced significantly but I bet bulls liked the price action especially the "smart money" buying at the end of the day. Personally, I would prefer to see market closing lower, 15-20 points towards the downtrend line, where some "weak  money" are going to sell, giving bulls more ammunition to conquer very important levels, 1105 (former 1067-1105 trading range) and eventually SMA200 that is around 1113.


SPX climbed a bit above SMA50 today for the first time since the beginning of the plunge, another sign that market gets strength on longer time frames.We did have a fake break out three weeks ago when SPX climbed above the 1100 resistance level and SMA200. Now the long term momentum is a bit better than back then but on short term market is overbought a fact evidenced by a briefly intra-day negative DMI on 60 minutes chart. Once again, bulls should welcome a retracement towards the downtrend line but that level needs to hold once touched.


babaro

Wednesday, July 14, 2010

Even God rested on the 7th day

SPX couldn't make it for 7 straight up days in a row (no coffee today for me?) but Nasdaq and Dow did. The battle for 1105 was postpone for at least another day. From 1096 (SMA50) to 1113 (SMA200) there is a whole resistance area that could slow down bulls a little bit on short time frame. The long term momentum is good (evidenced by the slightly positive daily DMI) so I am pretty sure we are going to go up from here. A retracement towards the downtrend line, today around 1075, is possible but overall chances are we are going up.


On shorter time frames I noticed DMI turning negative on 30 minutes chart, just to recover by the end of the day. This is not surprising keeping in mind that SPX advanced very rapidly from 1022 to 1095 and not as significant as an eventual negative DMI on 60 minutes chart that was a pretty good indicator of a trend change in the intermediate time frames in the last two months.


A quick look at the 3 possible intermediate/long term scenarios here (always need to play the devil's advocate).

The bullish scenario (+++)
-eventually SPX retreat towards the downtrend line but it moves up again from there.
-SPX goes above 1105, then 1113 (SMA200)
-daily DMI consolidates it's position
-long term uptrend resumes
-need to watch for EMA50 crossing above EMA100 on daily chart and DMI  on weekly chart turning positive to confirm the long term trend change.

The sideways scenario (++)
-SPX is back to 1067-1105 trading range
-SPX goes back to the downtrend line but the downtrend line does not hold
-slowly moves down towards 1045-1050 but not bellow. More pushes towards the upper edge of the trading range (11105)
-locked in the 1045-11105 area

The bearish scenario (+)
-SPX plunges bellow the downtrend line, support at 1045, the bellow 1022
-God help bulls at this point since it's hard to say where is going to stop.
-probably in the 900-930 area according to "head and shoulder" pattern, the same area where we can find the 2007-2009 recession downtrend line
-a hint that this scenario may happen is going to be a plunge bellow 1045-1050 support area
-even  a drop bellow the uptrend line is going to be an early warning. There is absolutely no reason for SPX to slip bellow the downtrend line, now around 1075 and going further down every day if this uptrend momentum is for real

Tuesday, July 13, 2010

Very bullish action

The most bullish event today was DMI turning green on daily charts for DOW and a little bit for SPX (I expect bulls to buy me a coffee for tomorrow by clicking on the adds!) Daily DMI turned negative at the end of April, around 1180, and it didn't turn green until today. This is very significant on long term. SPX is also "kissing" SMA50 for the first time since the end of April. It may be hard to believe but market is more bullish today at 1095 than was a month ago at 1120-1130 because all moving averages are going down (which is a bearish event by itself ) and are easier to cross.

Dow is the most bullish looking index right now but we know from previous experience we should put our bets on SPX since this index if more representative of the general market than Dow. With Intel results out the market doesn't have any reason not to go further up. Tomorrow we'll see the major battle at 1100-1105 then at SMA200 (1113)


With market above the downtrend line and daily DMI turning positive there is little chance that market will stop here. There are more ammunition for the bulls, RSI just turned bullish (above50) one more sign of the market's strength.


Volume was not spectacular but higher than the previous day.

I do expect market to go further up but not on a straight line, of course. It will be nice to see a retracement towards the downtrend line to get rid of the short term overbought condition then a push up above 1105. In the recent past, 1100 was the most important resistance level, bulls managed to pushed SPX above this level but they lost control in less than a week after that.

If you are a bear and don't trust this upward momentum don't gamble by guessing the top, wait to see the market moving down again before going short (watch DMI on 60 minutes charts to see if the move down is the beginning of  new trend or is just a down day inside a multi-days rally).

babaro

As expected!

No surprise today, stocks ended up the day pretty flat but I think tomorrow is going to be a different day, way more volatile than today. Alcoa is 3.5% up after hour which will probably set the tone for tomorrow. Bulls need to push SPX above the downtrend line. If they can do it next stop is going to be 1100 and by that time daily DMI may turn positive giving bulls even more strength.

Long term, the sideways consolidation continues. This is the calm before the storm since periods of sideways consolidation are followed by violent moves up or down. I can say that market is trading in range one more time (1,045-1,105)


the other too scenarios, a drop to1045 then sideways consolidation or a brake bellow the support zone around 1045-1050 are also possible but maybe not right now.


For short term traders I do recommend trading on 5-15 minutes charts , looking again for the cross between EMA50 and EMA100 as the buy/sell signal and keeping an eye on DMI, especially on 60 minutes chart.


Some stocks look really good right now, C and BP are two of them, daily DMI has turned positive for the first time since the beginning of the crisis.  I may be biased here since I am a bit long on both of them but look at the charts and judge for yourself. C may go up or down with the market but BP most likely is going to go up regardless the market direction, at least for a while.


babaro

Friday, July 9, 2010

Forth up day

Still more room to the upside or another good entry for your short ETFs? Four up days in a row and 60 points up in a week should make bears very nervous but the ball may still be in their court. I do expect a pull back as soon as the downtrend line is going to be hit (1080 today but on Monday it will be lower. These are visual estimates so they may be 2-3 points off in any direction). For bulls, a sideways consolidation is going to work the best. A small pullback from 1080 but no more than 30-35 points is going to allow them to climb above the downtrend line without too much effort. After that they may try to climb above 1105 and SMA200 one more time. Very bullish is going to be if the daily DMI is going to turn green for the first time since April 26. We are not there yet but keep an eye on this momentum indicator. The third scenario is SPX going down from the downtrend line with no support in the 1045-1050 area. This is going to spell more trouble for bulls since a drop bellow the previous low, around 1022, is going to be possible.


The uptrend this week was very nice. EMA50 did cross EMA100 today giving me another buy signal (although DMI on 60 minutes charts seems to be a better timing indicator lately). The price even climbed above the 5 days SMA. The trouble is that the volume did not confirm the movement! The volume actually went down from Tuesday to Friday. "Only price pays" so don't dismiss price action because the volume is low but is always better to have confirmation from this indicator. From bears' perspective this is exactly what they are expecting, drops on increasing volume and rebounds on decreasing volume. Of course I am talking about bears that are trading on longer time frames. Those trading on short time frames should be out of the market right now. Once again, pick your time frame and stick with it!


babaro

P.S. 1) I've got many clicks on the adds displayed on this page this week which make me think that the majority of the people visiting this page are bulls since I barely get any click on the down days :)

    2) Here is the solution for our troubled economy:

Third up day in a row

We didn't have three up days in a row since mid April. I don't think this is extremely significant, just a fact to cheer up the bulls. SPX cleared another two resistance levels, 1060 (the "neckline" on weekly chart) and 1067, the previous lower edge of the 1067-1105 trading range. DMI on 60 minutes chart has turned positive yesterday and has consolidated its position today. Market is moving way too fast for my timing indicators to make me money, especially EMAs crossing. I bet tomorrow EMA50 is going to cross EMA100 on 30 minutes chart even if market remains unchanged or is going down a little bit but at 1080 it may be a little bit too late. I say this because around 1080 is the second downtrend line and we may see some good resistance there. A sharp move down from 1080 is going to keep the long term downtrend intact and I would expect SPX to go slip bellow previous low, around 1020.


The only people making money in this environment are very short time traders, anybody else, either bulls or bears who kept their stocks longer than 3-5 days were lucky if they've got even in the last month or so.

I'll keep my eye on the main downtrend line. If SPX manages to close above this line it may give another shot at SMA200. A second scenario would be SPX moving down from the downtrend line but finds support in the 1045-1050 area, that is still going to be good for bulls. The third scenario is the one I mentioned above, SPX hits the downtrend line then goes down like a stone, with no support at 1045-1050, opening the possibility of moving bellow the 1020 low. I'll also keep an eye on DMI, a momentum indicator, especially on 60 minutes chart.

Have a look at some stocks that have shown some strength lately, CF, THO, CCRT, BP, MOS.

Thursday, July 8, 2010

Bulls win the day

Today was bulls' turn to scare the pants out of the bears. Bears are still in control on long time frames but they should be very cautious here since some important technical levels were blown away today.  The most important level is around 1050, the February-July resistance line, or (if you prefer) the neckline of the "head and shoulders" people are talking about. Weekly charts place the neckline around 1060 so I would say there is a whole resistance area (1045-1060) we should keep an eye on.


Bulls' main job here is to keep SPX above 1045-1050. The major danger comes from 1078 level where  SPX is going to meet the second downtrend line. If SPX bumps into the downtrend line then moves heavily down we are probably going to see lower lows, bellow 1020. But let's not anticipate, better react to the market moves. Right now, on short run bulls seem to be in control and this is evident from the fact that DMI on 60 minutes chart has finally turned green.


babaro

Tuesday, July 6, 2010

Another reversal day

It doesn't mean too much since it was a bearish reversal in a powerful downtrend. It does matter when it goes against the main trend like it did happen two weeks ago or on February 5th (bullish reversal). At least we finished in green today after 5 straight down days! As I said in the previous article if DMI on 60 minutes turns green bulls may hope for a short term rebound.


The resistance ahead is pretty good, first the downtrend line then the 1045 resistance line. On daily and weekly charts the resistance line is at 1050 and 1060 respectively so we should consider the whole 1045-1060 area as a resistance level (in general you should view support and resistance as areas not fixed levels). SPX did bump into the downtrend line in the morning (at 1040, not 1035 as I said in the previous article) then went down like a stone. Tomorrow is going to be easier to go above this downtrend line since now is stands around 1032. I won't have any bullish impulse unless I see at least DMI on hourly turned positive that is a very early timing indicator and therefore not as reliable as EMA50 crossing EMA100 on 30 minutes chart.


We do have now a weak 3 days support line at 1021 and a powerful downtrend line at 1032. On short term any close above 1032 or bellow 1021 will pick the winner. On long term things look really bearish, with  SPX bellow a flat SMA200. Unless bulls move quick SMA200 is going to tilt down, the ultimate bearish signal.

babaro

P.S. Meantime BP has generated a "buy" signal!


Bears refuse to take a break

Another terrible week for the bulls with SPX losing another 50+ points and major support lines being broke on the downside. The most bearish event, on long term, is the break out of the 1067-1105 trading range then  bellow 1050, the previous daily low.


On intermediate time frame I see the downtrend losing a bit of momentum. I judge this by looking at the DMI, that is almost turning bullish on 30 minutes time frame. Unfortunately, DMI on 30 minutes charts is not very reliable but if DMI turns bullish on 60 minutes chart, I'll take notice. So if you still have some longs in your portfolio better wait for a little bit longer to see what happens.

Two possible resistance levels ahead, one is the most recent downtrend line that now is around 1035, the other is, obviously, 1045 (or 1050 on daily chart) the former support line. A short term rebound towards these levels is possible (look at 60 minutes chart).


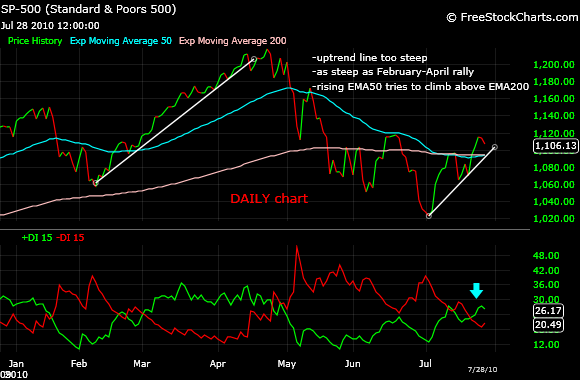
Another hint about of a small rebound comes from the daily chart where you can see the price just a little bit above the downtrend line. However, a drop bellow this line is going to be really painful for the bulls.

What is the bigger picture? Many scenarios are flying around, we are going into a double deep recession, we are going bellow March 2009 lows, Dow will go down bellow 1,000... You heard them all. Personally I don't really care if thismarket is going to hit 2,000 on SPX or 200. Of course I do care if the economy is heading up or down, we all have jobs, friends and families, but for the purpose of trading it doesn't matter. What it matters is to be on the right side, either long or short. So, when i say the bigger picture I am not referring to any of these scenarios, I am just looking at longer time frames (weekly charts) to see what messages market may send from there.


I am not fan of looking back at charts and saying "ah, I was supposed to buy here and to sell here". Anybody can do this, the real challenge is make these decisions in real time. Another trap is when comparing this recession with others in the past. Which one to chose, 1973-1975, 2003-2007, 1929-1933? We need to have a look at these past recessions but we need to be very careful about the extend of our conclusions. Every recession is different.

Let's have a look at the famous "head and shoulder" pattern. We do have a left shoulder around January's high, a head in April and a short right shoulder in June. the neck line according to weekly chart was around 1060. If I measure the distance between the top of the "head" and the neckline I am getting around 150 points. Subtracting this from 1060 I am getting 910, a level where the plunge should stop. I must say I am not fan on "head and shoulder", since you can imagine "head and shoulders" at any time and any place. Only a few of them are real. What you need to be concerned as a bull (or happy as a bear) is that SPX went bellow a multi-months support line, the one that 'head and should" fans consider now the "neckline".

The irony is that this time the "head and shoulder" prediction may be right. I am saying this because coincidentally the 2007-2009 recession downtrend line is around 930 which constitutes the major support line for the 2009-2010 rally.