Saturday, December 17, 2011

Bearish action

 SPX went up in the morning  3 times this week, just to gave up almost all gains. This is bearish, of course at least on short term.


The opposite is true when market tries to make a new low then bounce up immediately as that level is touched. Gold looks in this position at the moment. The major uptrend line is around 152 on GLD or 1560 on gold. Gold touched that level a few times intra-day followed by a move on the upside.


On intermediate time frame SPX it's exactly in the middle of the "symmetrical triangle". The upper edge is around 1255, the lower edge is around 1185. I am talking here about the symmetrical triangle formed in the last 3 months. If you look at the one formed by the uptrend line on weekly chart the edges are a little bit pushed further away, upper edge around 1260 and the lower edge around 1170. It doesn't really matter which triangle you have in mind since the edges are pretty much similar. The idea is if any of this edges are "conquered" the move in that direction is going to get speed. Since the 2009-2011 uptrend line was crossed already 3 times, another cross could be the one pushing SPX into a new, fresh bear market. 


According to my timing indicators we are already in the bear market (EMA 20 crossing EMA 40 on weekly chart, market bellow a declining SMA 200) but fundamentals are not there yet. As you know to be in a bear market we need to have two consecutive quarters with negative growth. Fundamentals are usually 6-9 months behind the technicals. Last recession market started collapsing in October 2007 but we didn't know about the negative growth on the first quarter until April 2008 and the bear market was official 3 months later when we had the confirmation that the second quarter of 2008 had also negative growth.

Wednesday, December 14, 2011

Really frustrating market, no trend at all, you cannot bet with confidence neither on the upside nor on the downside.  Is the 3 days in the row on the downside, indeed but yesterday morning SPX was around 1250. This is an excellent market for the day traders, for the rest of us, not so good.


Anyway, the daily DMI has turned negative, once again and as expected the weekly DMI remains on red as well. Looking at both daily and weekly DMI I can see some support in the 1217-1220 area. Market may move up a little bit from here but don't bet too muc on it. The major support, on weekly chart is around 1170. That's the level we should keep a close eye on. On intermediate time frame the uptrend line is around 1180 so this area, 1170-1180 is were the market will decide if it wants to go bearish or bullish on long term.


Gold has another bad day. The weekly DMI just turned negative for the first time in 3 years! Also for the first time in 3 years gold moved bellow SMA 200. Now the major support remains 152 on GLD (translated as 1560 on gold). Bellow this level things are going to get really ugly.


Monday, December 12, 2011

Gold

Important movement in gold today. GLD moved bellow the July-December uptrend line and now the next support level is around 1610, the YTD uptrend line. Bellow that is the September low around 1580


I don't think gold holders should panic yet since overall gold is still bullish at the technical level. The major support in my opinion is 1520, the 3 years uptrend line. Bellow that is going to be carnage but not yet. Gold may also find support around SMA200 (1,580). Speaking of SMA200 one should notice that is pointing up which is bullish. Also there is no "death cross" yet (SMA 50  crossing SMA 200 from above). Weekly DMI is still positive but not by much so pay attention to this long term indicator.


All the best!

babaro

P.S. I hope I'll have time to do an analysis of the general market at the end of the trading day.

Thursday, December 8, 2011

Finally some action

I lost count how many times SPX bumped into the 4 month downtrend line in the last few days. Today, with fresh news from Europe, market finally "decided" to move down. How much is going to plunge? The major support is the 2009-2011 uptrend line that is now around 1170.


First support level is in the 1215-1225 area where we can also find SMA 50. However, SMA 50 was pretty much ignored in the last year or so, it wasn't neither a good support or a good resistance level so if SPX is going to take a break in the 1215-1225 area is going to be due to a significant volume occurred at this level rather than due to SMA 50. SMA 200 on the other hand pretty much capped any significant gain since August until today. It is now around 1260.


On two hour chart I noticed that DMI turned slightly negative indicating that the recent mini-rally has come to an end.


On short term I expect more volatility and I don't think if the market is going to head towards 1170 is going to be in a straight line. On longer time frame market it also seemed to be volatile but as the "symmetrical triangle" narrows I expect SPX oscillating in between closer values. Any move above the 4 month downtrend line or bellow the 2009-2011 uptrend line are going to be followed by huge moves on the upside or the downside.

babaro

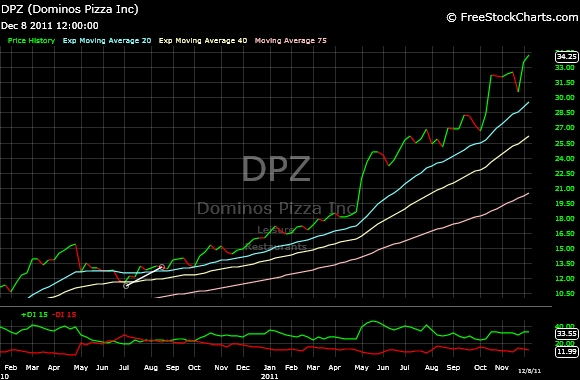
P.S. Can you imagine stocks moving up despite all the negativity around? And I am not talking about penny stocks, I am talking about stocks like, MCD, DLTR, DPZ.


Saturday, December 3, 2011

Reversal day

Market got close to the downtrend line (around 1265) but then went down. This is a bearish movement indicating that this week rally is close to an end. However, if market manages to go above the downtrend line and especially manages to establish a new high (above 1,290) then bulls are going to be in control for a decent period of time. It all depends on the European saga.


Weekly DMI continues to stay negative despite two powerful rallies we had since the beginning of October. Daily DMI on the other hand has turned positive once again. Remember DMI is a non-price type of indicator, it only takes into consideration the lows and the highs made during the previous day (or week) and gives information about the direction and the magnitude of the trend.


I added a few more stocks to my watch list. I don't own any of these stocks yet since I am waiting for something to happen first, a move above or bellow a trend line, a move above a moving average, weekly DMI changing direction...