Monday, June 25, 2012

Pullback

SPX moved bellow SMA 120 on hourly chart and we also have a bearish EMAs crossing. The recent rally was too short lived to be profitable according to EMAs crossing on hourly chart. 


I mentioned in a previous article that there were rumors of another QE. The problem is there are no official rumors on this subject just people guessing that we are going to have another round of QE based on not so good news in the economy and on the jobs front. 

If any of these rumors are going to materialize in the end remained to be seen but the most important news today was that another European country, Cyprus, was asking for a financial bailout. More likely this is not the last European country asking for help and the situation in Europe may be even worse than we imagine. 

On daily chart please notice that SMA 50 is still moving down while SMA 200 is moving up so we may see a cross between these two SMAs ("death cross") in a few weeks. The thing is on the other two occasions when the "death cross" happened since 2009, the event per se was not bearish but it was a good buying opportunity in the end. 


During 2003-2007 bull market we had three "death crosses", the first two being good buying opportunities but the third one was real. The difference between the first two and the third one was that SMA 200 was rising or stayed flat during the first two "death crosses" and moved down only in 2008. As a matter of fact moving bellow SMA 200 is not such a good indicator that a new bear market has started but a declining SMA 200 is a "kiss of death". Or it was until last year in August-September when SMA 200 started moving down and I was pretty sure that a new bear market has started. However, a new round of QE completely screwed technicals and instead of a bear market we had a pretty decent rally from 1,100 to 1,400. Trust me, without Feds' intervention there was no way that market could avoid plunging last year. 


Summer is always bad for stocks (with a few exceptions, of course) so I don't expect a sustained rally anyway, plus or minus the European saga. By August-September market may stabilize and chose a clear direction but until then expect more volatility. 

Gold, that usually follows the market, went up today despite dollar going also up but remains weak at the technical level. It seems to find support around 153 on GLD with a resistance downtrend line around 164. 


Silver looks even worse than gold but it may find support around 25 that coincides with the three years uptrend line. The resistance level is around 31 so we may see silver oscillating between these two levels.  Looking at the weekly chart one can easily notice that between 18 and 50 silver was in a big bubble. Right now is approaching the uptrend line, meaning the place were it was suppose to be all the time. During the same period gold was not in a bubble, it stayed more or less around the uptrend line. 


Friday, June 15, 2012

Rumors of QE3

Rumors about QE3 pushed SPX 14 points today and 17 points for the week. This is the second week in a row on the upside.  SPX made a higher high on daily chart and cleared two important resistance levels, one around 1,325 and the other around 1,332 after making a clear higher high on weekly chart last week.
SPX is now just bellow SMA 50.


On hourly chart we have a bullish EMAs crossing and price above a rising SMA 120. SMA 120 was challenged twice last week but resisted heroically. This move on the upside is also confirmed by the daily DMI that has turned positive for the first time since May 2nd.


To be honest I am a bit surprised by this bullishness especially keeping in mind that over weekend Greece is having new elections and depending who is winning Greece will be out of the EU zone or not but as I learned the hard way is never clever to argue with the market. Market is always right!


Gold is also rising due to the same QE3 rumors but it remains, technically, pretty weak with a "death cross" still present and weekly DMI in red. However on intermediate time frame things are improving (daily DMI has turned positive).

Monday it will be an interesting trading day after the elections in Greece.

Monday, June 11, 2012

Another reversal day

Futures were 8 points up this morning but SPX ended 16 points lower today. This is the second reversal day in less than a week. Obviously this is not bullish at all but in all fairness, bulls did a pretty good job last week and they still have a chance to turn the trend in their favor on intermediate time frame. Looking at the hourly chart please note that we still have a bullish EMAs crossing and SPX did not plunge bellow SMA 120. Actually SMA 120 was challenged twice in the last 3 trading days but it did hold nicely. 


Overall market remains bearish with weekly and daily DMI still in red. Daily DMI doesn't look that bad but weekly DMI is deeply in red. SPX didn't manage to make a higher high on daily chart. It pushed above 1,332 in the morning but it didn't hold. 


However, to cheer the bulls a little bit, weekly chart shows a clear higher high. It may also transform in a "diamond bottom" over time, a bullish pattern by all means.


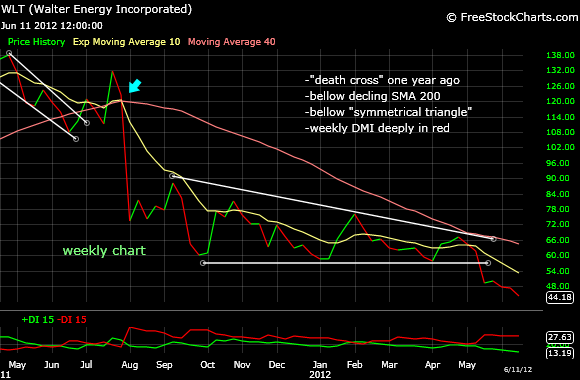
Metals and mining stocks were hammered today with X and WLT losing more than 6% and AKS not less than 14%. I like these stocks because they trend nicely either up or down. 


Thursday, June 7, 2012

Buy signal but reversal day

EMAs did give a bullish signal today confirmed also by SMA 120 on hourly chart. However, we had a reversal day, rally in the morning just to see all the gains gone by the end of the day. Dow was the only index that managed to preserve a little bit of its gains.


Daily and weekly DMI remain negative so one should be very carefully if he or she wants to get long here.


In order to get bullish we need to see at least daily DMI turning positive and a pattern of higher highs and higher lows. So far we have exactly the opposite, lower lows and lower highs both on daily and weekly charts. The good news is that SPX managed to climb above SMA 200 but is still bellow a declining SMA 50.

Gold was hammered again confirming the downtrend started a few months ago. 


babaro

Friday, June 1, 2012

Bellow SMA 200

A brutal week in stock market, especially today, with SPX losing around 40 points and plunging bellow SMA 200.As I mentioned before I was watching 3 support levels, 1,290 (head and shoulder prediction), 1,285 (SMA 200) and 1,250 (bull market uptrend line). 


Initially, 1,290 behave well and after slipping very close to this level (1,295) market jumped back to 1,320. At this level market had a failed attempt to climb above SMA 120 on hourly chart. 


The last obvious support level, and the most important one is the bull market uptrend line around 1,250. 
The bull market is going to be in a lot of trouble if is going to slip bellow this level.


Gold had a very good week but still looks vulnerable with almost all technical indicators bearish ("death cross" still present, negative weekly DMI, bellow the multi-year uptrend line). The good news is that is found support around  the January's low. Let's see if it can build something from here.