SPX recovered some of the yesterday's losses but remains bellow the downtrend line and bellow the 1105 resistance level. Daily DMI remains slightly positive indicating that the momentum is rather neutral right now.
One of this blog readers made a comment regarding my "buy/sell" signals based on EMAs crossing and made me aware that if one back-test the EMAs crossing on 60 minutes chart the system produces losses over time (he went back to 2006). I really appreciate his/her comments, you should never blindly trust anybody, especially when you are using your hard earned money, you should always have questions about what other people are saying even if they are well-known gurus, not to mention a blogger like me.
It is possible that I've got lucky with this pair of EMAs (25 and 50 on hourly chart) in the last couple of years? Yes, it is possible to lose money with these EMAs if the market is extremely choppy and if it has extremely sharp moves up or down. In these cases both the buy and the sell signals are coming too late. Trading is about flexibility, if I see I am getting whip-sawed too many times I am going to go to longer time frames, if I see the buy and sell signals are coming too late I am going to shorter time frames. I do this kind of switch from time to time but I keep coming back to EMA25 crossing EMA50 on 60 minutes chart (or EMA50/EMA100 on 30 minutes chart). Of course EMAs crossing is not the only thing I am watching, I also look at support/resistance levels, DMI and uptrend/downtrend lines.
The second comment my reader made was that EMAs crossing doesn't work in general. I do agree that EMA25/EMA50 may not be the best pair of EMAs but I disagree that EMAs never work. I mentioned many times that I am using EMA100 crossing EMA200 as a tool to spot bull or bear markets. Long term players can use them as a "buy/sell" signal but they are actually too slow for this purpose. I had the curiosity, for the first time, to look way back in the past to see how good their signals were. Look at the charts bellow and judge for yourself if EMAs crossing works or not. I know it's hard to believe that a simple system like this can beat sophisticated computer programs or prophecies made by gurus you see daily on TV.
I can't look on daily charts for longer than two years or on weekly charts longer than the last 10 years so I had to look on monthly charts. The problem is that 100/200 days EMA results in EMA 5 crossing EMA 10 on monthly chart, two moving average hard to follow visually. Even if this pair of EMAs are too slow to actually generate good "buy/sell" signals you will notice that their performance in the last 40 years was pretty impressive.
First let's have a look at 1971-1981. EMAs crossing made 91%, "buy and hold" made 40%
1981-1991, "buy and hold" worked better, EMAs had two losses, one during 1987 crash and the other during 1991 crash. Both were too short lived to make them profitable by going short when the sell signal was generated.
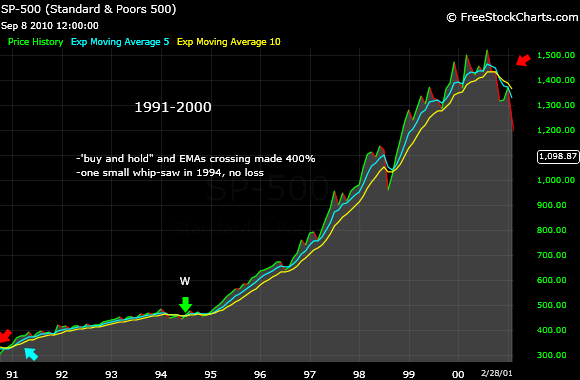
1991-2000, both "buy and hold" and EMAs crossing made 400%. Wow! A minor whip-saw in 1994 generated a "buy" and a "sell" virtually at the same level.
2000-2003, "buy and hold" crew got crashed for the first time in years. EMAs crossing made a lot of money. 2003-2007, both "buy and hold" and EMAs made the same amount of money.
2007-2009, "buy and hold" lost 27%, EMAs crossing made 34%.
Except for 1981-1991 period EMAs crossing was net superior, especially in the last 10 years when not only kept players out two terrible bear markets but generated huge profits on the short side. After looking at these data I can confidently conclude that EMAs crossing is a valuable tool. It all depends on finding the right pair of EMAs and there is no other way than looking in the past and see what worked back then. One should keep an open mind and realize that the past does not predict the future but the past is a good starting point. Finding the right time frame is another issue. Less experienced players should consider longer time frames. I am not good enough to do day trading, not even day-to-day trading. I do feel comfortable with intermediate time frames, those that give buy/sell signals on 60 minutes chart. My reader may be right and maybe I've got lucky with EMA25/50 so I'll keep an eye on this pair to see if is going to perform well in the near future.
All the best!
babaro


Thank you for a thorough explanation of this trading mechanism over time babaro.
ReplyDeletePW
What a great way to deal with the reader feedback. Most useful, honest post I've seen in quite a while!
ReplyDeleteI agree with the previous post that you turned my feedback to positive use. You have valid points and didn't take offense at my points. Great job on this analysis.
ReplyDeleteThanks for the feedback, guys.
ReplyDeleteTradetree, I've been humbled by the market way too many times to afford the luxury of NOT listening to any point of view out there. Plus, I am also a scientist and like challenges.
Perhaps we can collaborate in the future. I am very serious about trading and have already been humbled myself. I am not a professional trader as I am also in the sciences. But I have put a lot of time into algorithm development and I have some good results to show for it. Perhaps I'll pass some results and situations past you when I'm at a good point. How can I send a private email?
ReplyDeleteyou can contact me at
ReplyDeletebabaro13@yahoo.com