Finally we have a "golden cross" confirmation on the daily chart after we saw this crossing happened on weekly chart a couple of weeks ago. The only resistance ahead is around 1,365, the previous high but I don't think it's going to be a problem since two other indexes, Dow and Nasdaq, already established higher highs.

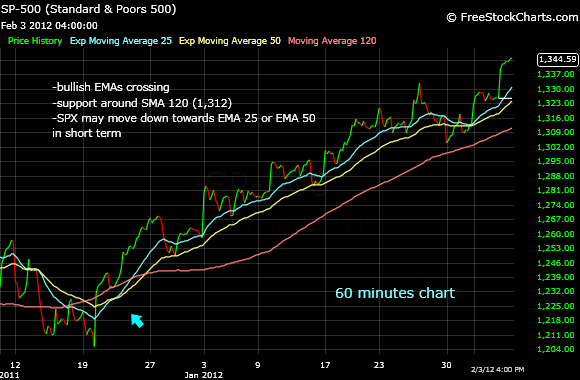
Needless to say that market is bullish on all time frames. However, on short and intermediate time frames we may see a little pull back or at least market trading flat for a few days. I say this because I am seeing SPX 12 points above EMA 25 on hourly chart and 18 points above EMA 50. As you noticed many times, SPX stays mostly around these two EMAs. Also, on daily chart DMI is pretty high, another reason market may cool down a little bit.
Long term looks very bullish, with EMA 20 crossing EMA 40 from bellow and market above SMA 75, the MAs that defined the bullish and bear markets in the last 20 years. This year we had a 100 points whip-saw, not too bad if we look at the big picture. Whatever happened in the second half of the last year was very serious, actually the biggest challenge this market had since the 2009 bottom so I am not too upset about the whip-saw.

Weekly DMI is relatively low showing that on long term more gains are posible.
All the best!
babaro
No comments:
Post a Comment
Thank you for your feed-back